Tackling Africa's Mapping Challenge with Fuzzy Matching

As part of our WHO AFRO collaboration work, I'm working on defining boundaries for approximately 70,000 sub-districts across Africa. We’re matching lists of sub-district data that Ministries of Health have submitted to WHO with a separate dataset: geographic boundaries. In theory, we’re just matching place names from health datasets to boundary datasets and/or geocoded health facilities. But there's layer after layer of complexity as we've scaled to dozens of different countries with their own data collection processes.
One of the challenges is that health datasets and mapping organizations use different naming conventions for the same places. On top of that, manual data entry leads to spelling and formatting issues. There is no universal system that connects "Kong A Assis" from field data to "Kong Assis” (the same place) on an official map, or handles the typos and spacing differences that occur during data collection.
That's the problem we're tackling with fuzzy matching algorithms. Instead of manual reviews, we match names that are similar but not exactly the same. That means we choose the high confidence matches, leaving only the indiscernible cases for humans to fix. These mismatches frustrate almost everyone who uses geographic data, so we have been working with several folks who are tackling this problem also. Ultimately we want to offer a high-quality, simple-to-use placename matcher as an open-source tool.
Where the data comes from
For our project, we’re working with sub-district level program data from WHO's ESPEN program that tracks neglected tropical diseases across Africa. We are using geographic boundary and placename files from various sources including those provided by country programs, and ones we source on the UN's Humanitarian Data Exchange (HDX), OpenStreetMap, Geopode, and others.
- ESPEN program data shows where neglected tropical disease interventions are happening and which areas are considered endemic.
- The boundary files show us where these places actually are on a map.
The challenge is how these places are named. Across different places and at different times, various organizations and planning teams use completely different naming standards. There's no universal ID system linking all these variations together.
At the scale we're working, processing tens of thousands of sub-districts across dozens of countries, these naming inconsistencies create matching challenges at every turn.
Enter fuzzy matching
So how do you figure out whether "Kong A Assis" from field data matches "Kong Assis” from available boundary maps? That’s where fuzzy matching comes in. Instead of requiring perfect spelling matches, fuzzy matching is an analytics approach that uses algorithms to find probable matches even when names vary slightly. It’s like an autocorrect system for geographic data.
To start the process, I've been using the most common algorithm for fuzzy matching called the Levenshtein distance. Using Python libraries, this algorithm counts how many single-character edits you need to transform one string (a place name in this case) into another:
- "Kong A Assis" → "Kong Assis" = 1 edit (remove the "A ")
- "Kandawa" → "Bakiyawa" = 4 edits (K→B, n→a, d→k, w→i)
When I see a Levenshtein distance of 1, that's usually just a spacing or capitalization difference. That's a safe match the algorithm can approve automatically most of the time. I've also added checks for complexities like numbering systems (e.g., "Kabwe 1" and "Kabwe 2" have a distance of 1 but are different places). Higher distances require more careful review. I'm also looking to see how long the word is: a word with 15 characters and a Levenshtein distance of 1 is a more probable match than a word that is 3 characters long with a distance of 1.
We're also using Soundex for fuzzy matching, which matches based on how names sound when spoken rather than how they're spelled. This catches variations that Levenshtein distance might miss, like "Khartoum" versus "Kartum" (the same city in Sudan), where they sound alike when spoken but look quite different on paper.
As we work with these different techniques we are learning how they interact with one another, and how we can leverage their interactions to improve our match rate. For example, in one case the algorithm was trying to find a match for a place called "Oglewu Icho." Soundex returned a match for "Oglewu-Ehaje" with a Soundex distance of 0. However, there was a record named "Oglewu-Icho" that was clearly the correct match even though the Levenshtein distance was greater than the Soundex distance associated with the false positive (a Levenshtein distance of 1 versus a Soundex distance of 0). Cases like these helped us discover that running a pass where we grab matches with a Levenshtein distance less than or equal to 1 greatly improves subsequent passes using Soundex.
Having direct control over how we apply these matching algorithms helps us process thousands of variations without spending tons of time checking each one by hand.
Checking for false matches
Before approving any match, I also check what we call the administrative levels – ADM1 (like a state or province) and ADM2 (like a district). Boston (MA) and Boston (TX) might look identical in a spreadsheet, but they're in different administrative regions. Since these datasets include this administrative-level information alongside place names, I can easily catch where names match but the places are completely different regions.
Setting confidence thresholds
Administrative checks help prevent obvious errors, but they don't solve the bigger challenge of deciding which fuzzy matches to trust in the first place. When you're automating at this scale, trust in your matches is everything.
Set the bar too low, and you'll incorrectly link different places that happen to have similar names. Set it too high, and you miss obvious matches with minor typos – like missing the clear connection between "Kong A Assis" and "Kong Assis." These are matches you could spot with an eyeball test, if not for having to do it thousands of times.
Tying it together with Python
To implement this at scale, I work with the datasets loaded into spreadsheets. Python programming libraries (particularly Jellyfish, which includes Levenshtein distance algorithms) run the fuzzy matching across thousands of place names and produce output spreadsheets with potential matches and confidence scores that I can then review and approve in batches.
For example, when I ran this process on Kenya's data, this approach gave us 1,238 perfect spelling matches out of about 1,440 total places. Those are easy wins we can lock in immediately. Kenya required more work to connect the remaining unmatched records. That's where the fuzzy matching algorithms really help things along.

But with fuzzy matching, that remaining gap of roughly 200 unmatched records in Kenya isn't random. The difficulty of closing that gap depends entirely on the quality and consistency of the original data collection. That's why the "right" threshold varies dramatically by country:
- Some datasets have incredibly clean, consistent spelling
- Others have regional naming patterns that create systematic differences
- Manual data entry quality varies wildly between organizations
Since there's no universal standard, I iterate through each country testing different confidence levels. Names with a Levenshtein distance of 1 usually look safe to approve, but as that number increases, humans need to get involved. We’re still working on the best solution for those.
The truth is, even with our best algorithms, some cases will always resist automatic matching. That’s why we're taking an 80/20 approach. We solve as much as possible algorithmically (hopefully the 80%) and then later we’ll focus on the genuinely unknown 20% or so of situations.
When boundaries don't exist
Sometimes the fuzzy matching approach hits a dead end. Or you end up with too many mismatches that fall below your confidence threshold, leaving gaps in your coverage. But the bigger problem? We have place names in our health data, but when we search for corresponding geographic boundaries to match them against, they simply don't exist.
This is actually pretty common. Many countries never digitized boundaries for their smallest administrative units, or the official maps are decades out of date. When there are no boundaries to fuzzy match against, we need a backup plan.
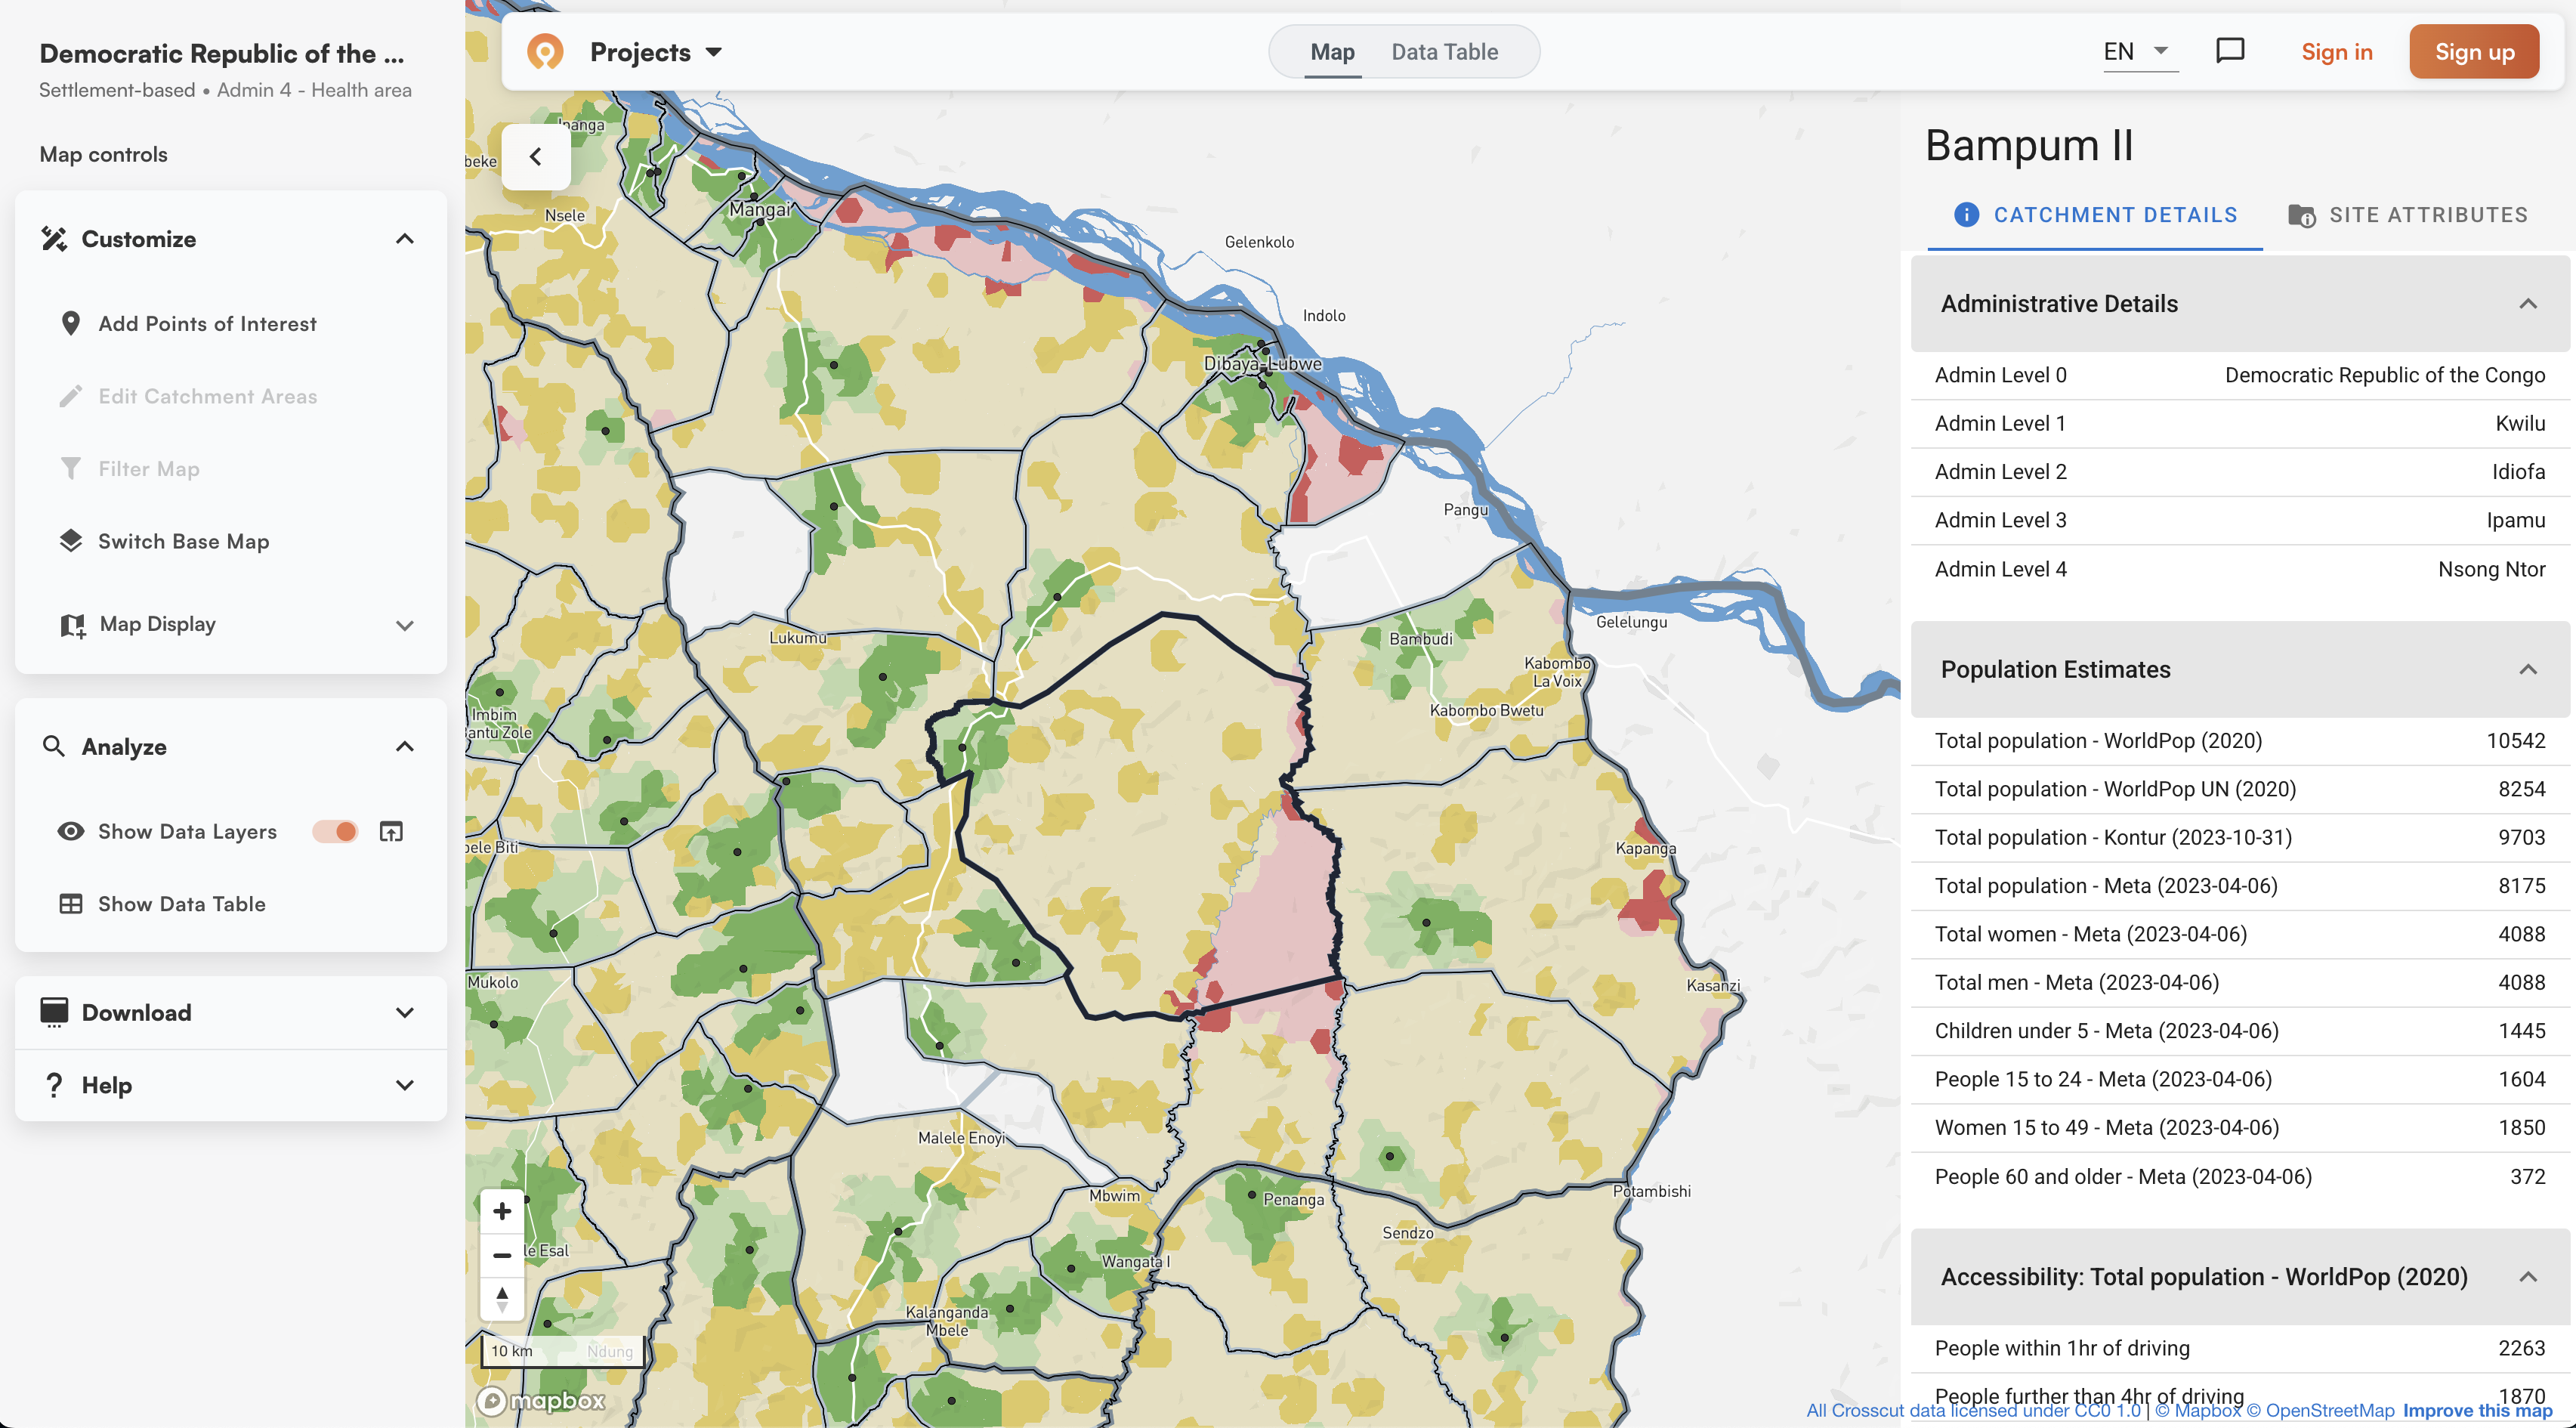
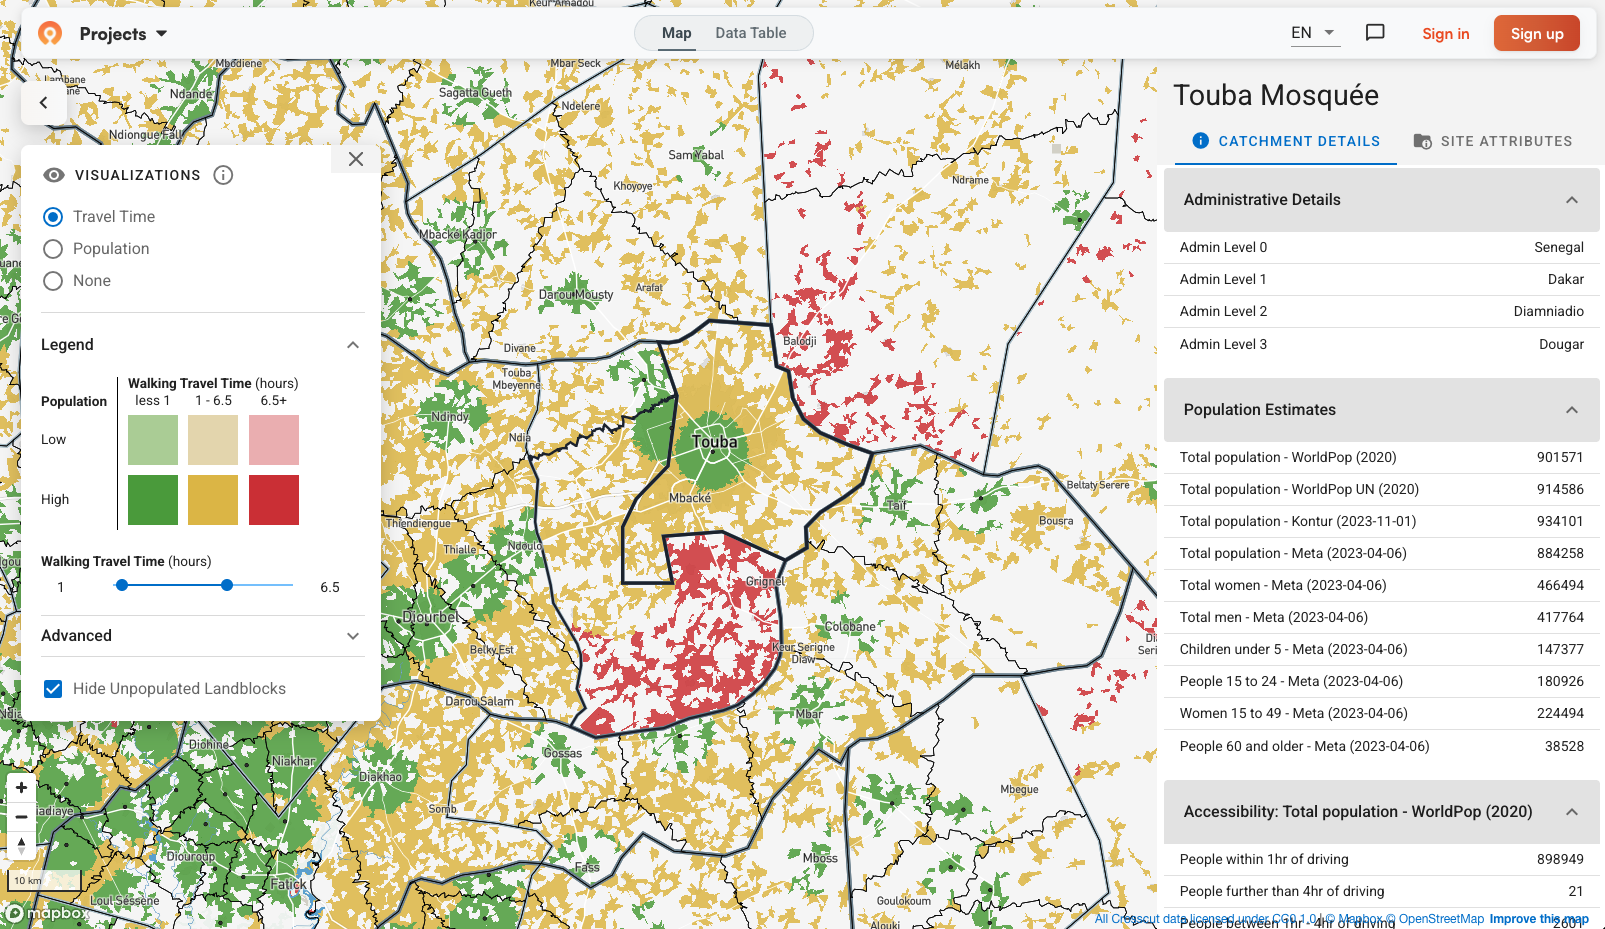
That's where we switch to our second approach: creating boundaries from scratch by using the Crosscut App to generate catchment areas for named places. Instead of trying to match existing data, we build what's missing.
Turning to catchment area generation
Say our health data lists "Herelandia District" but we can't find any boundary files for it anywhere. We search for "Herelandia" as a town or settlement to get GPS coordinates for the main administrative center, like a health facility, government office, or district headquarters. Then we use the Crosscut App to generate a catchment area around that administrative center, modeling which surrounding communities would logically be served by it.
The result isn't an official boundary, but it's functionally useful to plan interventions and resource allocation. Often these generated boundaries actually reflect reality better than outdated official maps that don't account for how people actually travel to access services.
Whether we're fuzzy matching existing boundaries or using GPS coordinates to model new service areas from scratch, it all comes down to giving health teams the geographic precision they need to make targeted decisions.
Making every match count
The real payoff comes when health teams can finally target interventions at the sub-district level instead of making broad district-wide decisions. Instead of saying "this district has low disease transmission," they can identify the specific villages where transmission is actually high and focus their limited resources there.
As I write this, I'm still working through Python scripts, testing thresholds and match rates across different countries. The algorithms are helping us automate the bulk of the work while keeping humans in the loop to try and put together the final pieces of the planning puzzle.
If you're making program decisions without clear location data, let’s talk about how to fill in the gaps.
Related Posts

What is a catchment area? A GIS guide for non-technical teams

GIS Terminology Explained: A Practical Guide for Non-Technical Teams


