
Assessing Active Cooler Demand with The Crosscut App
Reaching every child in the world with vaccines remains one of global health's toughest challenges. One major obstacle is that most vaccines need to be kept at refrigerator or freezer temperature all the way from the factory where they are made to the hospital, clinic, or community health post where they are used.
Accessing communities in cities, towns, and urban areas is often straightforward. Most people live close to their local health facility, and there is usually a well-established cold chain infrastructure consisting of vaccine cold rooms at national and provincial stores, and vaccine fridges at district stores and health facilities. However, some communities in remote rural areas live multiple days of travel from their nearest health facility and may not have access to mains power.
Current outreach limitations
Today, health workers travel to those communities to conduct vaccination “outreach” visits, carrying their vaccines in passive portable vaccine coolers. "Passive" in this sense means that the coolers have no moving parts or power source involved: they are similar to the plastic coolers you might take on a picnic. Ice, gel, or cold water packs are placed in the cooler to keep the vaccines cold. However, since these packs eventually melt and warm up, these coolers can keep vaccines cold for at most 1-2 days.
As a result, there are several situations where passive coolers can't provide the duration of cooling required to reach certain populations via vaccine outreach:
- Some communities in the most remote rural areas live 5+ days of travel from the nearest health center
- Some countries deploy vaccination teams to border crossings, where they can be stationed for up to a week at a time, without reliable local access to ice
- In geographies with extreme heat (e.g., parts of Balochistan province in Pakistan can reach up to 53°C / 127°F in the hot season), passive coolers can only keep vaccines cold for a few hours rather than a full day or more, limiting the distance of communities that can be visited during outreach
Innovative solutions for extending reach
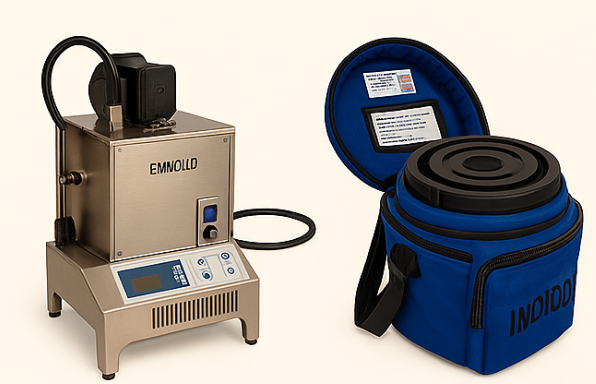
To address these types of situations, innovators have developed a new class of Transportable Powered Vaccine Storage (TPVS) or "active coolers”. These are devices that can be easily carried by one person and have advanced technology to allow them to stay cool for several days. Two have been tested and prequalified by WHO:
- The Indigo backpack cooler by EMK uses evaporative cooling technology to keep vaccines cold for up to five days without external power.
- The Emvolio cooler by Blackfrog uses battery power to keep vaccines cool, with a single charge lasting up to 24 hours. The battery pack can be swapped out to extend this duration.
These devices have exciting potential to bring vaccinations to children in remote communities. But how many of them might be needed – and where?
To answer these questions, we did demand modeling based on health facility catchment areas to assess demand for active vaccine coolers. This covered several countries, including Afghanistan, CAR, Chad, DRC, Niger, Pakistan and South Sudan. I collaborated with Crosscut to conduct the demand modeling, with the Crosscut app providing support for catchment mapping and geospatial analytics.
A data-driven approach to estimating demand
Our approach consisted of the following steps:
- Align on specific geographies for modeling. We focused on geographies that would most likely benefit from extended outreach with active coolers and receive supplemental support for routine immunization.
- Document current outreach practices in each geography. How many hours or days do health workers travel from their facility during an outreach trip? How often? Do they go on foot or use a vehicle? What cold chain equipment do they currently use?
- Develop catchment maps for each health facility. A catchment map specifies which communities are served by each health facility. The Crosscut platform was used to build catchment maps based on health facility location data either provided directly by Ministries of Health or available via public datasets such as GeoPoDe. In two countries where we lacked data on health facility locations and only had the total number of facilities, the Crosscut app used known population centers to model the likely locations of health centers, which were then used to develop catchment maps.
- Create an estimate of the current "outreach zone" within each catchment area. Which communities can current outreach practices actually reach? Typically, this zone consisted of communities within 4 hours of travel from the facility, so that a health worker could visit a community, conduct vaccinations, and return in a single day. The Crosscut app made these outreach zone estimates using public data on roads, terrain type, and terrain steepness to inform travel time calculations.
- Assess how many health facilities have communities lying outside their current outreach zone. Each of these facilities could benefit from having access to at least one active cooler.
- Evaluate the population living outside the current outreach zone. This provided an estimate of the potential impact (in terms of additional children vaccinated) from the deployment of the new vaccine coolers.
Visualizing the challenge
The analytics involved in the project were visualized using “heat maps” for each geography. Figure 1 below shows the heat map generated for Hadjer Lamis Province in Chad. The small black dots at the center of the green patches represent the locations of health facilities (from a publicly-available list on GeoPoDe). The black lines divide the map into catchment areas, one for each facility, that indicate which geographic areas are served by each facility. The color shades represent travel times from each facility:
- Green zones represent the areas that a health worker from the local facility can reach within 1 hour of travel
- Yellow zones are the areas within 1-4 hours of travel. Typically, this is the greatest extent of a 1-day outreach trip, since the health worker needs to allow time for the return trip back to the facility
- Red zones are the areas 4 hours of travel or more from the nearest facility. These zones (and the communities within them, indicated by the darker red shapes) are usually not served today by outreach trips
Every health facility that has at least one red-zone community in its catchment area is a candidate for an active vaccine cooler. These lie primarily in the center, east and south-east of the province.
▶ FIGURE 1: Hadjer Lamis Province in Chad.
[Legend: Green indicates areas within 1 hour of travel from the health facility. Yellow, 1 to 4 hours from the facility. Red marks more than 4 hours away.]

Figure 2 shows the heat map for Haut-Lomami Province in DRC. In densely populated areas, especially in the east and north of the province, single day outreach is often sufficient to reach all communities. In other areas, particularly in the center, west and south of the province, multi-day outreach is often needed and active coolers could be beneficial.
▶ FIGURE 2: Haut-Lomami Province in DRC.

From analysis to action
This demand modeling approach has allowed global health partners to quickly build an understanding of where the new active coolers may be useful. The initial perspective on demand can then be refined in discussion with stakeholders in each individual country.
To date, the Indigo cooler has been piloted in South Sudan and DRC
If your organization is exploring similar questions around service delivery or equipment demand, the Crosscut App offers free catchment mapping tools to support early analysis and planning.
Related Posts

How the Crosscut App helps plan health campaigns in Nigeria

An independent evaluation of the Crosscut App
.JPG)

How to set up a Microplan Collector project in the Crosscut App
