
Integrating CommCare and ODK for Automated Catchment Maps
Data collection tools like CommCare and ODK Central capture GPS coordinates while users are working in the field. During health campaigns, supervisors go into communities to verify services like vaccine administration or bed net distributions are happening as planned. They track these visits with the exact latitude and longitude of every stop.
Having that data helps avoid missing areas or duplicating supervision visits, but only if the data is transformed into a digestible format.
We therefore built an integration that automatically pulls this data from CommCare and ODK, generates site-based catchment maps in Crosscut, overlays accessibility heat maps, and updates them daily. This update allows supervisors to analyze supervision activity during active campaigns with maps that update daily to track coverage patterns.
Fixing the manual workflow
Before this integration, teams downloaded their survey results from CommCare or ODK and cleaned the data in a spreadsheet. They could then upload the CSV to the Crosscut App and wait for the map to render. The workflow is still faster than using traditional GIS tools, but it’s hard to find the time during hectic campaigns.
Next, users would layer on accessibility heat maps or public population data for each map. Tracking coverage across days meant reconfiguring settings and scanning separate maps each time. Configure Monday's layers, then do it again for Tuesday. By Thursday you've burned an hour toggling settings and switching maps. It was about a 10-20 minute task each morning.

This is why tracking coverage usually happens after campaigns, when time isn't pressing. But it’s not there when teams need daily data to adjust where supervisors go during the campaign.
Daily catchment maps with one click
Brianna and Emmanuel have been leading the integration work with data from our country projects in Nigeria, Guinea-Bissau, and Liberia (we'll recap that work in the coming weeks) to build this integration. Brianna focused on the daily automation. Every morning, the Crosscut App reaches out to CommCare or ODK through the API, retrieves the survey points with GPS coordinates, and generates an updated site-based catchment. No downloads or manual configurations for users.
Emmanuel built the URL configuration piece. He embedded visualization parameters directly into the link so it opens with accessibility layers already enabled withthe right settings. Program coordinators (who are managing supervisors and field teams) don't need to know how to use the app. The URL defaults to the most recent map so teams use the same link daily and see the latest data. If they switch to the previous day’s map, the same settings automatically apply.
Supervisors were already logging daily visits in these data collection tools. Working with Ministries of Health and partner organizations in these countries has helped us design a solution that fits directly into their existing workflow.
Automated catchment map workflow
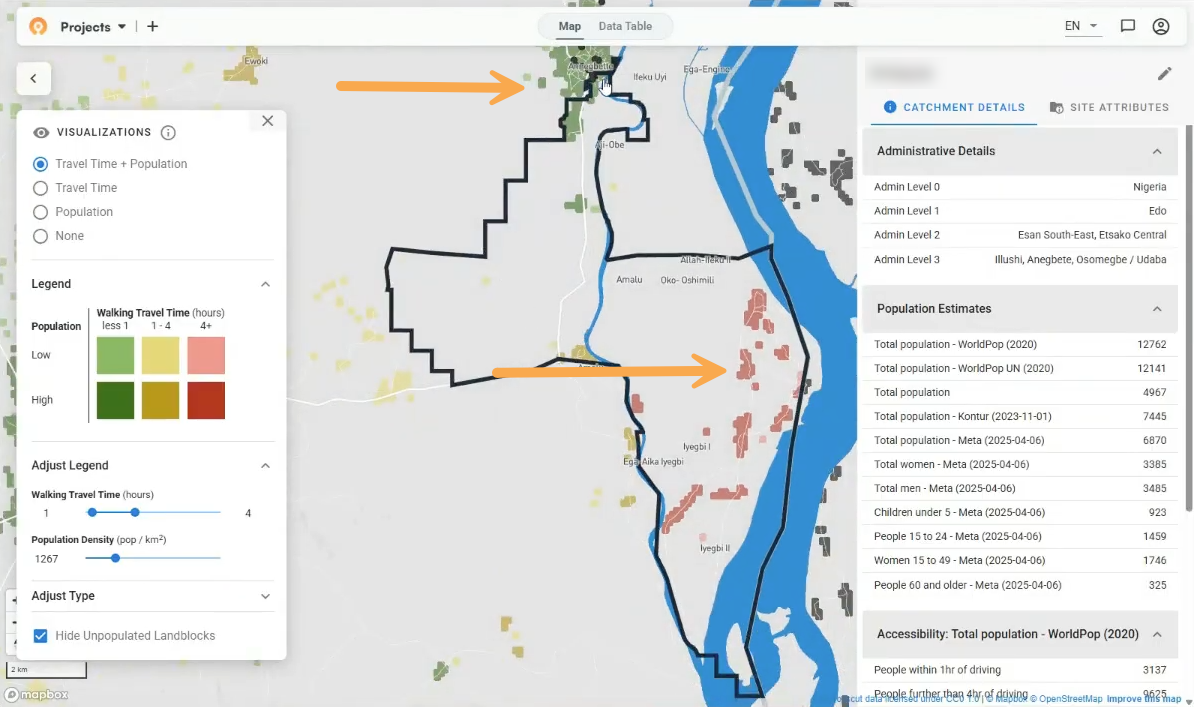
Program coordinators click their link each morning and see an editable accessibility heat map that compiles their supervision coverage up to that day. They have the option to toggle configurations but the map automatically displays the previous day’s settings by default.
Users can very easily see which areas are far from any recorded supervision activity and direct supervisors to prioritize filling in those gaps where appropriate. During the campaign, areas that were previously red should turn yellow, and ultimately green as supervisors log visits that are closer to these areas. Automating this process shortens the feedback loop and saves time.
Filtering data for specific contexts
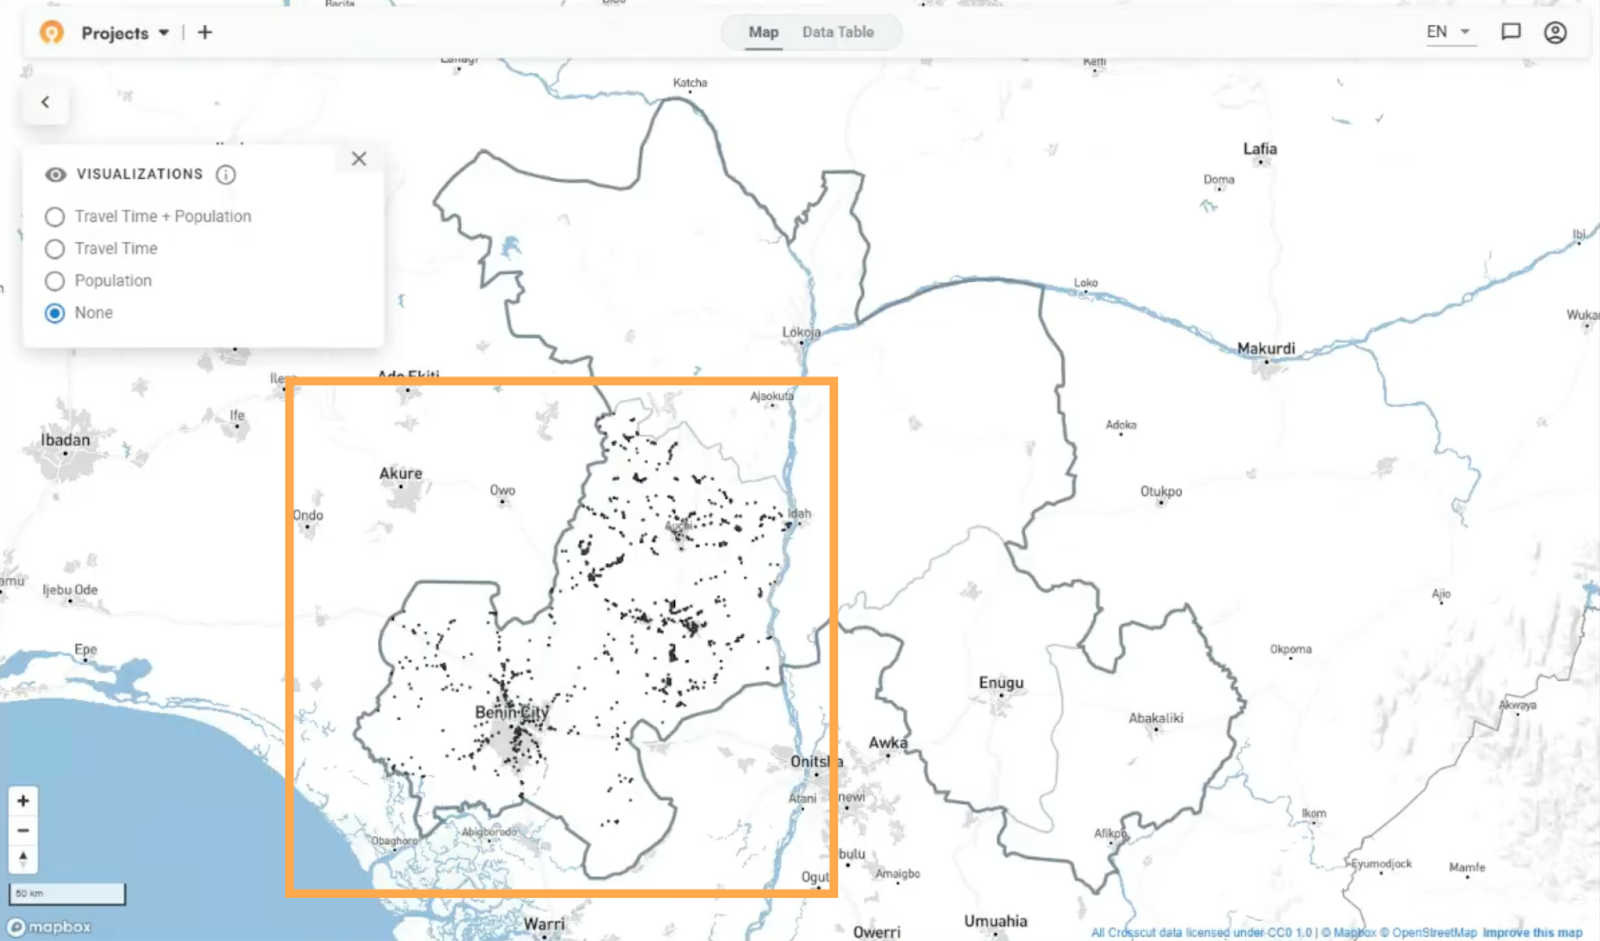
The daily maps update automatically, but teams don't necessarily need to see all survey data at once. Recent country projects have shown us that different regions run campaigns on different schedules. For example, Edo State's onchocerciasis campaign runs separately from other Nigerian states.
We work with teams to add custom filters to the daily script. These filters only process points within certain administrative areas or surveys from specific date ranges. A national program running campaigns in three states sees only those states. Regional data from other parts of the country doesn't clutter the maps. A pilot project tracking the past two weeks sees current campaign progress without historical data from previous years.
Planning teams only see their relevant data without manually downloading and cleaning files to remove other areas each morning. And the filtering happens automatically in the daily script.
Different from other integrations
This isn't our first integration, but it is different from others. With our DHIS2 integration, the health information system reaches out to the Crosscut App to pull catchment data.
Here, Crosscut initiates requests to pull survey data from CommCare or ODK. The directionality impacts what and how we build these solutions. CommCare and ODK are the data sources that Crosscut queries, while DHIS2 acts as a consumer of Crosscut outputs.
Both patterns achieve the same goal of simpler catchment maps within existing workflows.
Broader monitoring and evaluation
The integration focuses on existing workflows rather than adding new ones. Field teams already use CommCare or ODK for daily work. Supervisors already log verification visits with GPS. What we built with MOH and partners doing the work on the ground automatically turns those existing logs into coverage analyses. The coordinates supervisors capture during normal work become the spatial data coordinators use to identify gaps and track progress.
Working closely with these campaigns helps us build solutions they actually need, and connects to our monitoring and evaluation framework for tracking whether coverage improves.

Current status and next work
Teams in Nigeria, Guinea-Bissau, and Liberia now have daily maps to track their work. We're working with programs to refine filters for their specific regions and timeframes. And getting maps into the dashboards coordinators already use for tracking campaigns, not as separate links to remember. These would be small but significant time-savers over multiple campaigns.
For programs using CommCare or ODK who want automated coverage monitoring configured for their specific setup, advisory services help match integrations to existing workflows.
Related Posts
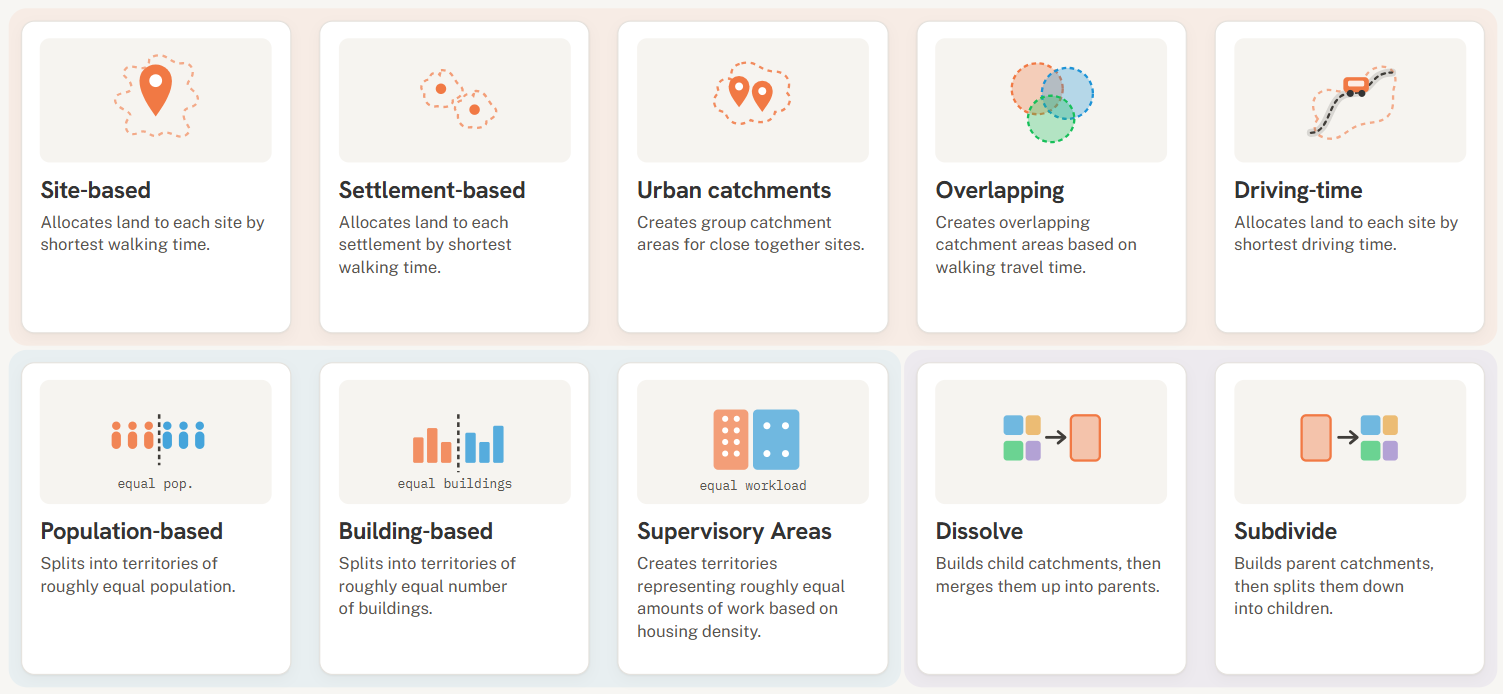
Choosing the right catchment area mapping method in the Crosscut App

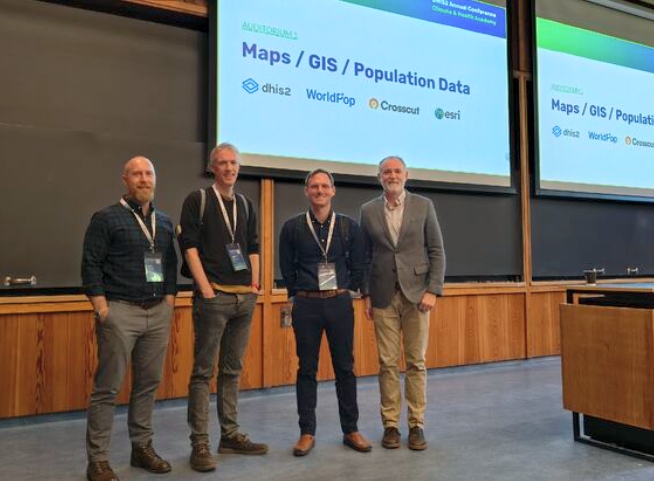
DHIS2 Annual Conference 2026
.JPG)

How to create catchment area maps in DHIS2 with the Crosscut App
