
November 2025 updates: Smoother workflows and faster maps
November had us working on different fronts. We automated data connections to CommCare and ODK (mobile data collection tools), updated our population visuals, and fixed several backend issues that were slowing down country processing. A lot of this came directly from what we've been seeing in our ongoing country projects.
Simpler supervision gap analysis with ODK and CommCare integration
We've detailed the ongoing work on supervision gap analysis in our Nigeria and Guinea-Bissau country projects. Both countries use CommCare and ODK to track specific GPS locations of where supervisors actually go during campaigns. This data shows which communities received verification visits (e.g. "Were there any issues with the distribution here?”) and which didn't.

The challenge was getting that data into our maps quickly enough to be useful. Teams had to manually download supervision visits from CommCare or ODK, upload them to create site-based catchments, then update the visualization. During active campaigns, coordinators don't have time for that workflow.
Brianna built an integration so the Crosscut App now automatically extracts supervision data from CommCare and ODK once daily and updates the analysis. Teams can check yesterday's coverage each morning and redirect supervisors to areas that need attention.
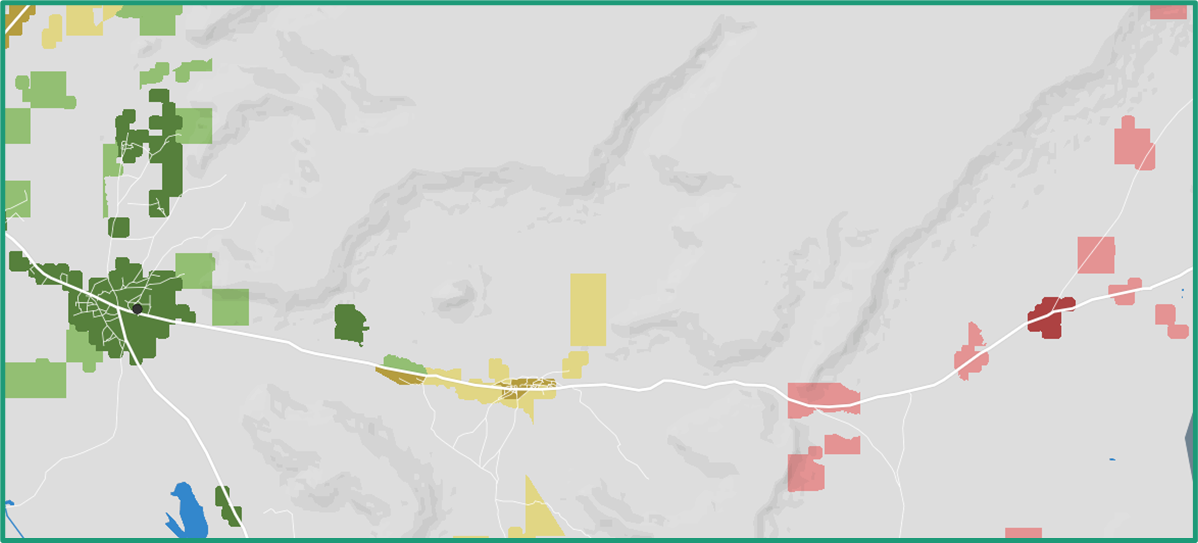
Each country uses their field data slightly differently. In Nigeria, we worked with the team to compare this year's supervision coverage against last year's data to find gaps that still need attention. In Guinea-Bissau, the goal was to monitor daily progress across their balanced supervisory areas, tracking which zones have been checked and which still need coverage.
We'll share more details on this integration next month, including how it's working in our initial Nigeria country project, Guinea-Bissau, Liberia, and a second Nigeria pilot in Kogi State.
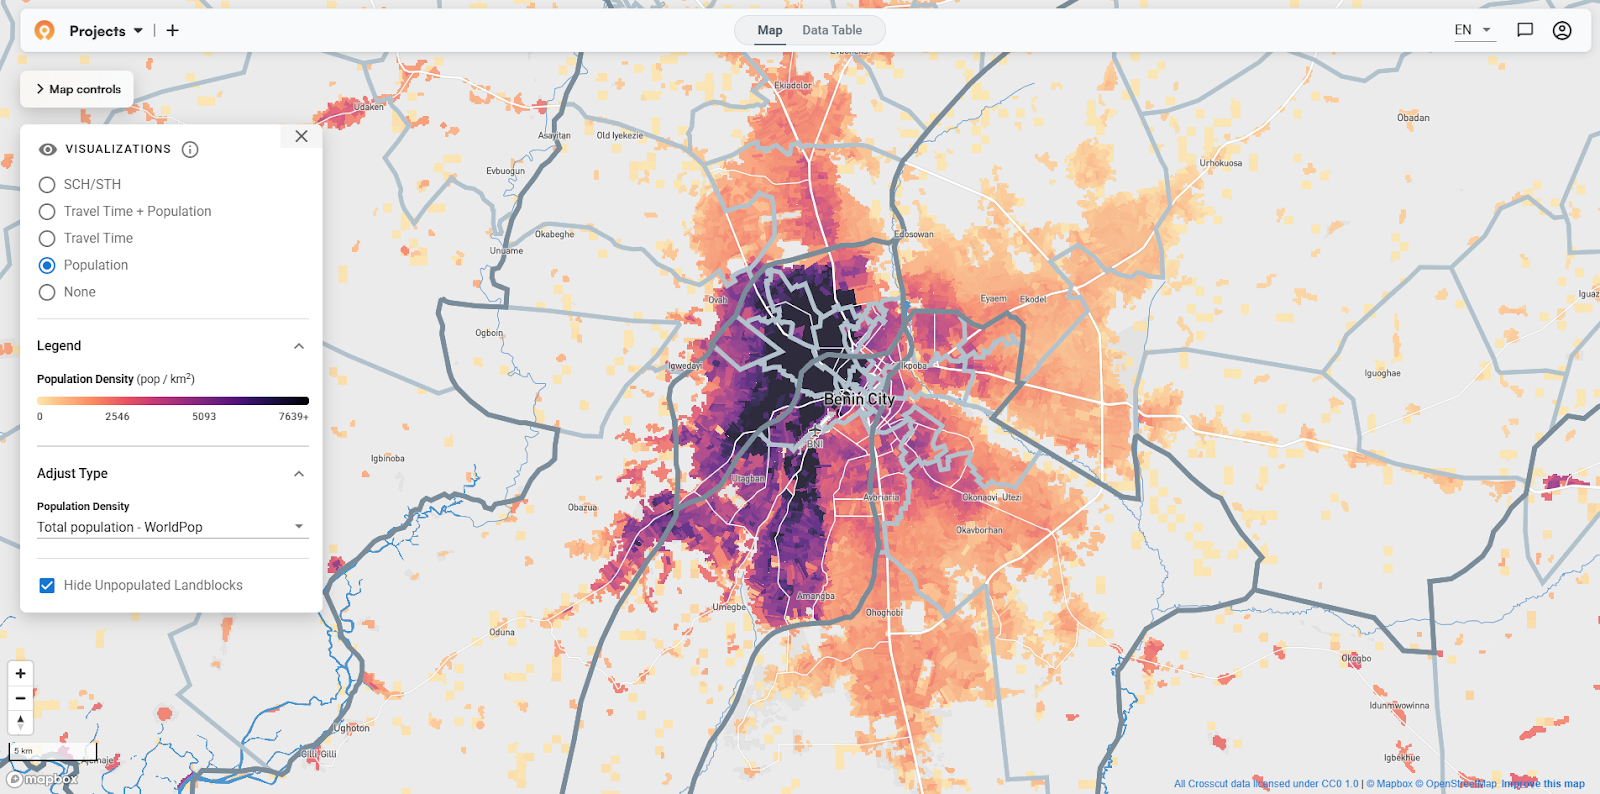
Updated population density colors
We weren’t really a fan of our old pink-to-red color scheme. Emmanuel focused on switching us to something cleaner that uses a continuous gradient instead of three separate buckets, creating smoother transitions from less-populated to more-populated areas.

The change is fairly subtle but makes maps easier to read when teams are toggling between data layers during planning meetings. The zoomed-in view shows how the gradient captures more nuanced density variations across individual settlements.

Added Overture building data
Emmanuel also added Overture as a new data source for building estimates, joining OSM and Google Buildings. Overture lets us consolidate building footprints from multiple sources (OSM, Google Buildings, and Microsoft), then removes duplicates to avoid double-counting.
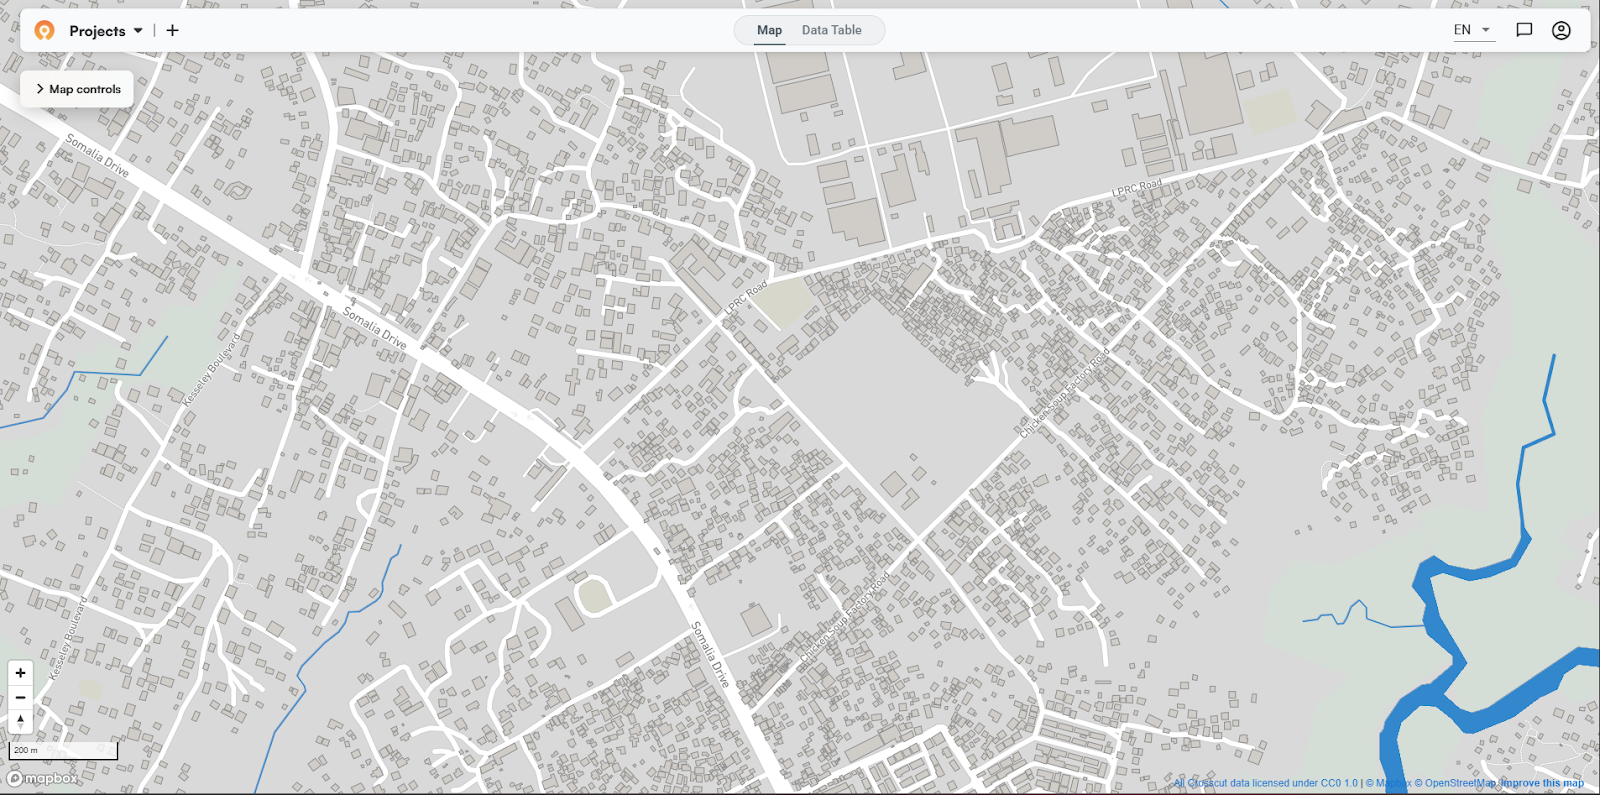
Multiple building data sources provide planning teams with more complete coverage during health campaigns, particularly when one source has better data than another.
Improved land block shapes
We’re continually looking for ways to improve land blocks, our base layer for creating catchment maps. Sam reworked how we generate these shapes. We used to pull settlement edges from WorldPop and create smooth curves around them. The problem was those curves needed many data points to draw accurately, which slowed everything down.
Now land blocks snap directly to the raster grid. Unpopulated areas become standard grid squares. If a land block exceeds one square kilometer, we break it into 500m by 500m squares. These square shapes need just four points instead of dozens, making everything faster. It also prevents tiny slivers of no man’s land from floating between blocks.
More reliable country loading
Beyond the visible changes, we worked on updating how we process new countries:
- Better handling of AWS Spot Instances. We use AWS Spot Instances to add new countries to Crosscut because they're cheaper than standard rates. The tradeoff is calculations can be cancelled if AWS needs the computational power elsewhere. We improved the code that automatically restarts these tasks when they get killed and generally improved how the system recovers from interruptions. This reduces the engineering time we spend babysitting country processing jobs.
- Stopped duplicating tilesets. Part of processing a country involves creating tilesets for the Microplan Collector's map visualizations. We used to create unique tilesets each time someone created a new Microplan Collector project. Since these tilesets were identical, we were wasting storage. Now we create tilesets once when we process a country, and each new project points to these existing ones.
- More robust boundary graphs. The most complex part of country processing involves boundary graphs, which power our travel time accessibility heat maps. A boundary graph defines movement costs between land blocks - roads make travel easier, rivers and forests make it harder. . Sum those costs block-to-block and you get travel time to any destination. Originally, we were loading gigabytes of data into memory at once, hitting Node.js heap limits. Emmanuel reworked it to process data in chunks, making country loading faster and more reliable.
The automated CommCare/ODK connection came from watching teams spend too much time tracking supervision data during campaigns. The land block improvements came from performance testing showing we could make things faster with simpler shapes. The country loading fixes came from frustration with failed processing tasks.
Everything we build goes into the free version of the Crosscut App. If you want to keep up with these updates, sign up for our monthly newsletter – or reach out through our Advisory Services.
Related Posts

How to create catchment area maps in DHIS2 with the Crosscut App
.JPG)

How the Crosscut App helps plan health campaigns in Nigeria

