
What 50+ Global Health Leaders Told Us About Microplanning

We recently surveyed over 50 health officials and implementing partners about how they plan campaigns to prevent and treat neglected tropical diseases (NTDs). What we found is a costly disconnect between planning aspirations and operational practice.
Why this disconnect? It's not because decision-makers ignore the importance of good planning. According to the survey findings, nearly everyone agreed that investing in more granular, community-level microplanning is worth the resources, even if it means reducing time spent on other activities.
Carried out in early 2025 on behalf of the WHO AFRO’s ESPEN program, this research points to a planning gap that goes beyond just global health initiatives. As funding models change and populations continue shifting across countries and regions, these insights offer a path toward smarter, locally informed planning and resource allocation.
▶ Download the complete research findings (PDF)
Who we heard from: A cross-section of stakeholders
We gathered insights from a broad mix of stakeholders:
- 56 survey responses
- 13 in-depth interviews
- Coverage across 27 countries in the WHO Africa region
Respondents came from Ministries of Health NTD Programs and implementing partners like The Carter Center, Sightsavers, Evidence Action, and others. We heard from national NTD coordinators, M&E officers, program staff, and technical consultants.
To gain deeper insights directly from survey-takers, we coupled the microplanning survey with 13 in-depth interviews. We wanted to hear from the people who shape how NTD planning actually happens on the ground and get their feedback on what we saw in the surveys.
Before we get into the survey results, let's clarify a few terms commonly used in disease campaign planning:
As we'll see in our findings, where organizations collect their population data within this hierarchy makes all the difference between planning that works and planning that doesn't.
Microplanning that isn't very "micro"
Microplanning is all about leveraging insights from front line health workers on target population estimates, at-risk communities, and how to reach them. In the case of NTDs, microplanning is the bottom-up planning done to prepare for mass administration of prevention medicine or services to keep these diseases at bay. Microplanning helps identify any missed settlements and helps rectify consistent undercounting that often occurs in rural, hard-to-reach areas.
Looking at the survey data, we saw a disconnect between planning goals and operational reality. Although 82% of respondents say they engage in microplanning, only 46% are estimating populations at the community or sub-district level – the true essence of "micro" planning. The majority work with broader IU data that can mask important local variations.
This gap between top-down planning (using district-level figures) and bottom-up planning (gathering community-level data) has real consequences. Without granular data, resources don't reach the right people at the right time. Medicines might go unused in one area while shortages occur in another. Teams might be deployed where they aren't most needed. The result is wasted time, money, and missed opportunities to help people.
While our research focused on disease campaigns, the same challenges show up across business sectors, government services, even political campaigns. Just about everyone struggles with the gap between high-level data and street-level reality.

Why good data comes too late
This "not-so-micro" planning issue gets more complicated with a paradox we heard about repeatedly. The best population data is rarely available up front, coming after MDA campaigns and other programs are already well underway. As one program manager explained:
"During the treatment phase, we rely on baseline data collected directly by the implementation units... Ideally, we should be able to use this field data for drug needs quantification, as it better reflects reality than census data, which are only projections."
This creates a familiar chicken-and-egg problem. Teams seek out the most accurate data to plan the most precise campaigns, but the most reliable numbers often come from the campaigns themselves. This results in programs submitting medicine requests based on early projections, then scrambling to adjust once better data starts coming in from the field.
With 63% of respondents starting their microplanning less than three months before campaign launch, there's often not enough time to gather fresh data. The short runway leads teams to use the data they have at hand.

Juggling multiple data sources
To deal with this tight timeline when trying to estimate populations, most programs triangulate multiple data sources. Census projections are the default starting point for nearly everyone, but 71% said they regularly use at least three sources, including health facility records, previous campaign data, and community registers.
This triangulation is necessary but often manual, which makes it a time-consuming process. These administrative challenges are a core theme: "We just use Excel for the sake of comparison, it's easy just to see the differences using formulas. We are interested in more training on this topic."
Despite the availability of newer geospatial datasets like WorldPop or GRID3, only 11% of respondents regularly use these resources. Most cite limited GIS expertise as the biggest barrier. That gap suggests that with better tools and basic training, teams could start their planning from a stronger baseline.
Still, programs that engaged in local-level microplanning reported greater confidence in their estimates. What this suggests is that even partial improvements make a difference.
The Excel-email ecosystem
Some of the most consistent responses were about tools. 97% of respondents use Excel to collect and aggregate population data, while 91% distribute templates via email. While use of systems like DHIS2 come up occasionally, they typically complement rather than replace these familiar tools – similar to what we've seen in our DHIS2 integration work.
This Excel-email workflow persists because it works. These two tools are almost universally available and understood. But they’re unwieldy for those who aren't as technically proficient. 67% said spreadsheet aggregation is challenging, and 44% struggle with email list maintenance. A missed email or corrupted file can stall a national plan.
A missing reply from one district, a corrupted file, or a typo in an email address can stall an entire national plan. As I've explored in our article on Microplanning with Email and Excel, these familiar tools create both opportunities and challenges.

The mapping gap
Maps are critical for campaign planning but they’re often missing or underused. Among WHO-recommended microplanning activities, "preparing operational maps" was the most commonly skipped. While most countries have some form of catchment area mapping (visual representations showing which communities are served by which health facilities or teams), they aren't usually used during planning stages.
Most respondents said these boundaries exist, but they're typically only available on paper at local levels or in technical formats at central offices. As one interviewee put it: "At the district level they don't know shapefiles. That's an issue." This lack of technical GIS knowledge at lower administrative levels creates a significant barrier to using even existing mapping resources.
Beyond technical constraints, field workers often struggle with reading and interpreting maps. One program manager shared that it was a challenge for some people to understand how to orient the map to the current location using the legends: “I really apologized to them that I should have given them a whole day of training on how to use the maps."
The barriers are clear: lack of GIS training for planners, low map literacy among community workers, and software that doesn’t match field conditions.
▶ What accessible mapping actually looks like
With simplified layers and offline-ready maps, the Crosscut App fits Excel workflows and integrates with DHIS2.
Planning isn't just about maps
Microplanning isn’t just about maps and population figures. Genuine microplanning has to account for logistics, supply management, team deployment, and budgeting. Because microplanning often occurs very close to the campaign start, resource and supply allocation often occurs using different data earlier in the process and is usually managed separately from the microplanning effort.
As one respondent emphasized: "It is important to introduce tools to allocate resources and to monitor resources. It is very important to understand where to assign supervisors as well as where to provide technical support for districts." Tools that can integrate these different planning aspects could significantly improve operational effectiveness.
Reaching hard-to-reach communities
Planning gets even harder in places with limited access due to terrain challenges or security issues. In the survey, rural areas were the most frequently cited concern. Distance (and everything that stands between point A and point B) impacts accessibility but so does safety.
Community health workers play a crucial role in these situations: "We rely heavily on information provided by community health workers to reach populations living in areas with difficult access due to security or infrastructure issues."
In some regions, access is more than a logistical challenge: "Our health people know that people are living in that area but they don't know how many and they cannot go there themselves because of fear that they may be kidnapped."
How do you plan services for places you can't safely visit? Remote estimation techniques using satellite imagery, population models, or proxy indicators become particularly important when direct access isn't possible. These tools don't replace local knowledge but can significantly enhance it.

Planning lessons across sectors
The challenges we uncovered aren't specific or unique to global health. They mirror planning issues faced in many private industries:
The solutions, such as route optimization, data visualization, and integrated planning systems, are just as relevant here as they are in commercial sectors.
For funders and donors, these findings highlight an opportunity. As program budgets tighten, investments in planning can yield outsized returns by improving overall program efficiency. Better targeting means more people reached with the same resources.
What we learned
This research has been immensely helpful for our team as we think about how to shape the Crosscut App to improve microplanning for health campaigns. Here are some of the conclusions we are walking away with:
- Most people believe microplanning improves target population estimates and helps target hard-to-reach communities.
- Microplanning is important, even if it means not doing some other things.
- Microplanning needs to occur several months before the campaign to be most effective.
- Increasing use of operational maps at lower levels is very difficult, and training should be expected.
- Triangulating multiple datasets to arrive at final target population estimates needs to be a foundational aspect of any microplanning tool.
- Almost everyone uses Excel and email to do microplanning.
Over the course of this year, we are incorporating these findings into how we design the Crosscut App, which powers tools like The ESPEN Geospatial Microplanner.
What is the Crosscut App?

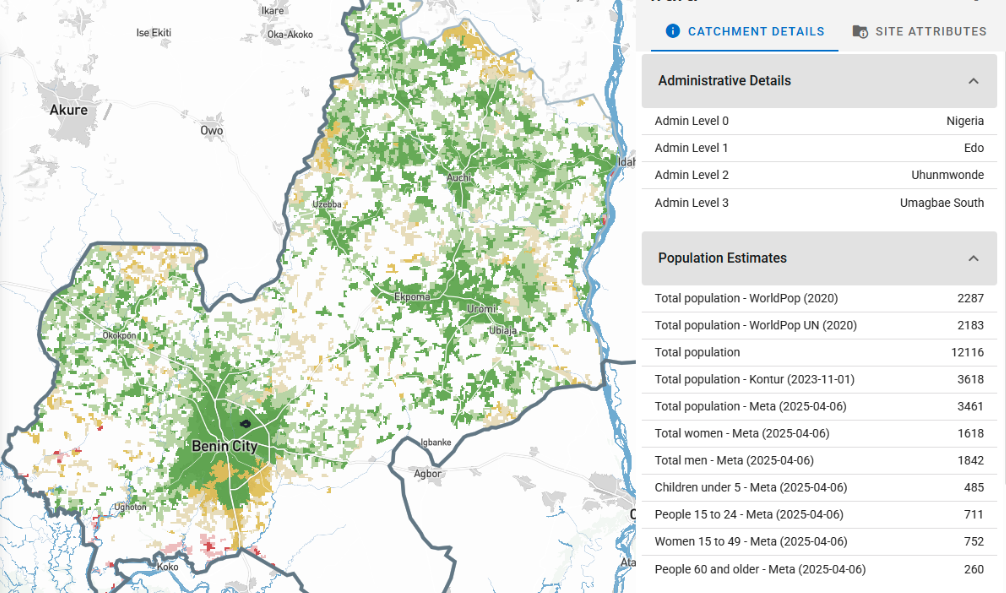
The Crosscut App is a web-based tool that complements existing country systems by offering two core features: (1) automated catchment area mapping and (2) centralized aggregation of Excel-based microplans. Users can rapidly generate sub-district catchment maps and heatmaps to support outreach planning, with outputs fully compatible with mobile applications and DHIS2.
For microplanning, national planners can disseminate Excel templates to districts, automatically ingest returned files, and visualize data for analysis. These microplans can be benchmarked with population datasets (e.g., WorldPop, GRID3, Meta) to support more accurate targeting and resource allocation in health campaigns.
Looking for smarter ways to plan at the local level? Let’s talk about how this research connects to your goals, and where better mapping tools might help.
Related Posts

How the Crosscut App helps plan health campaigns in Nigeria

An independent evaluation of the Crosscut App
.JPG)

How to set up a Microplan Collector project in the Crosscut App
