
Accessibility analysis and supervisory area planning for Kogi State

We recently supported Sightsavers and the Kogi State Ministry of Health as they prepared for a mass drug administration campaign targeting schistosomiasis. This country pilot project covered three districts in Nigeria’s Kogi State, called Local Government Areas: Lokoja, Kogi, and Ibaji.
This support was provided on a fully remote basis. I worked with two Sightsavers in-country focal points who learned the ESPEN Geospatial Microplanner (a white-label version of Crosscut), worked with me to generate the analyses, and presented recommendations to the MOH. They were the interface between our tools, supervisors, and local teams on the ground.
Identifying supervision gaps
This project had three main objectives. The training walked through how to identify supervision gaps from last year's health campaign, make training centers more accessible for more people, and create balanced supervisory areas across all three LGAs.
We started with the supervision gap analysis, similar to other recent work in Nigeria. The teams analyzed last year's supervision data collected through CommCare, their mobile data platform. They use this data to identify communities that hadn't received follow-up visits (from supervisors who check into how well the campaign is going). Those became priority targets for this year's campaign.
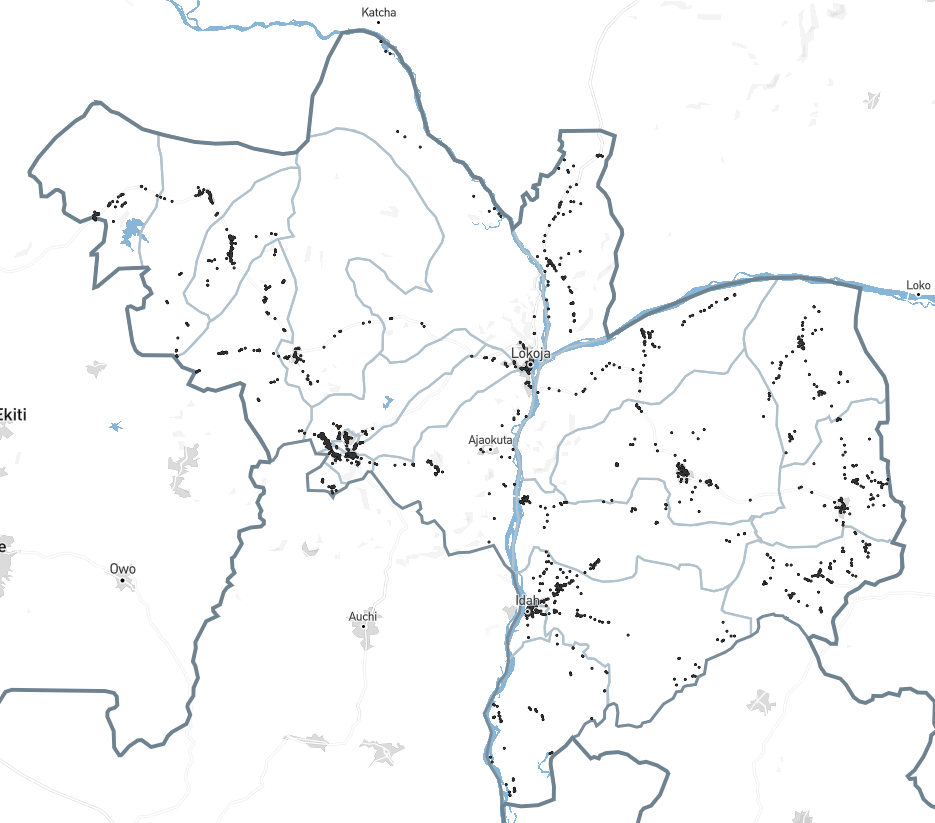
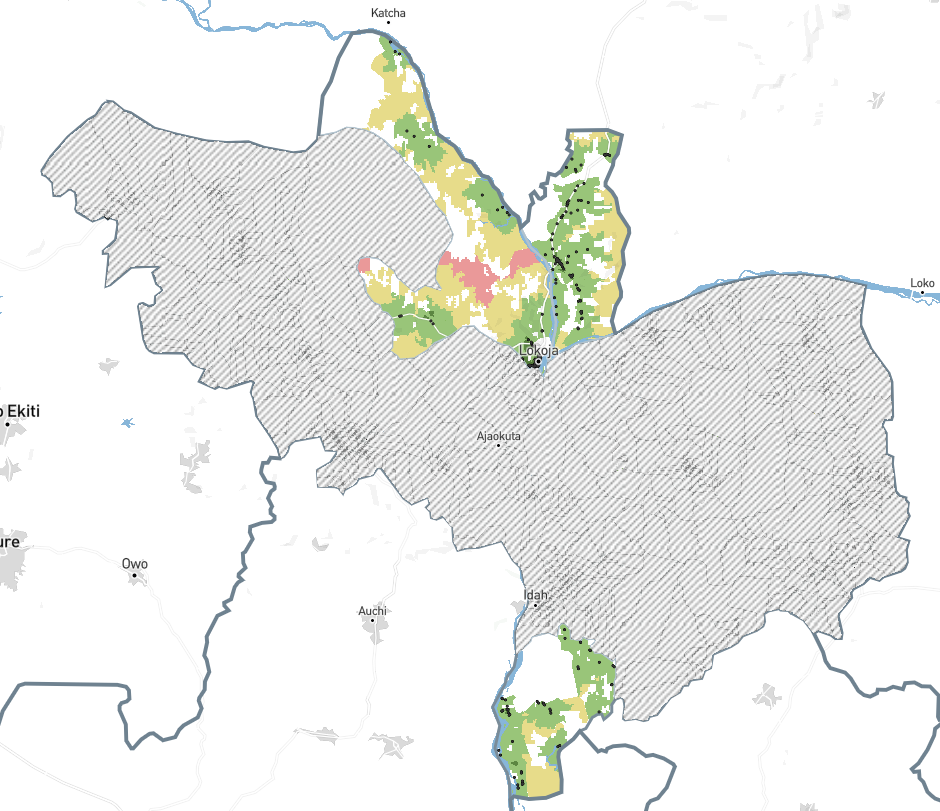
We then overlaid accessibility analysis across the three LGAs. Red areas indicated communities more than four hours from any supervision visit last year. Yellow areas were between one and four hours away. Green areas were less than an hour away. Black areas were out of scope.
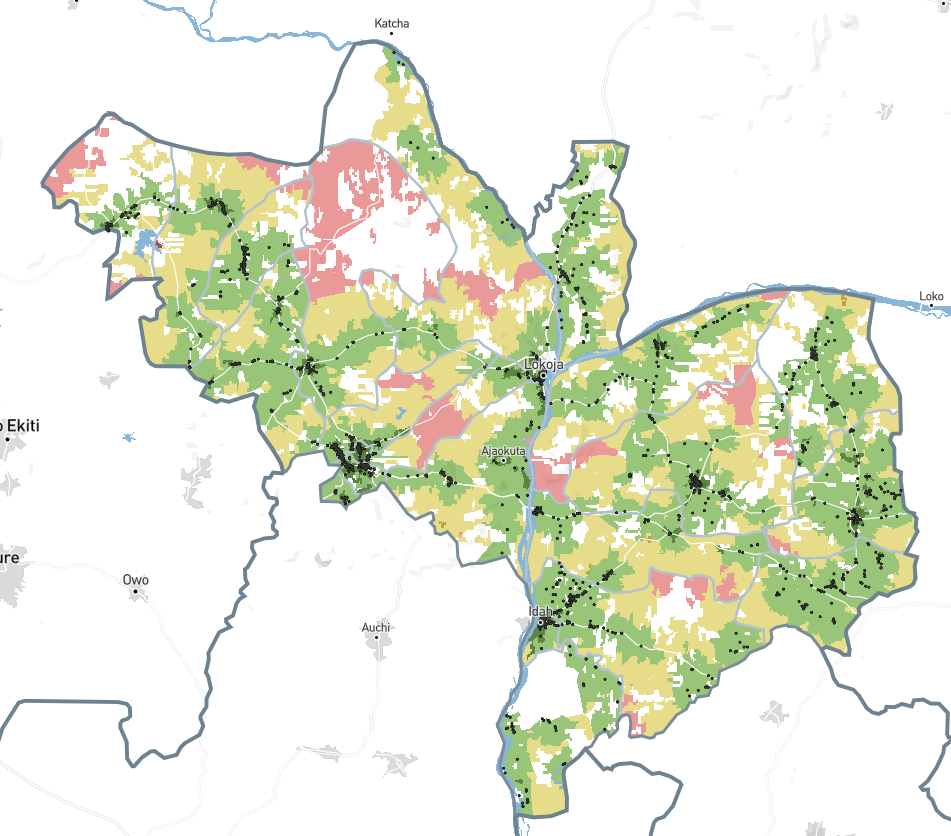
We identified priority communities in each LGA and marked them for follow-up using the Points of Interest feature. Some LGAs had significant red zones requiring attention. Others showed fewer gaps, letting teams focus on improving coverage in the yellow zones between one and four hours away.
Analyzing training center accessibility
This second objective involved a first-time use of our app to identify new training locations. Before campaigns start, community drug distributors (CDDs) and supervisors attend several days of training at primary schools. Kogi's policy says workers shouldn't have to travel more than two hours walking to reach training centers. Previous campaigns had complaints about these distances, with trainees complaining that they had to travel an unreasonable amount to reach their assigned training center.
The analysis was based on the same core approach as the supervision gap analysis, this time assessing how far communities were from their nearest training centre location. This allowed us to suggest existing schools within those red areas that would fill coverage gaps.
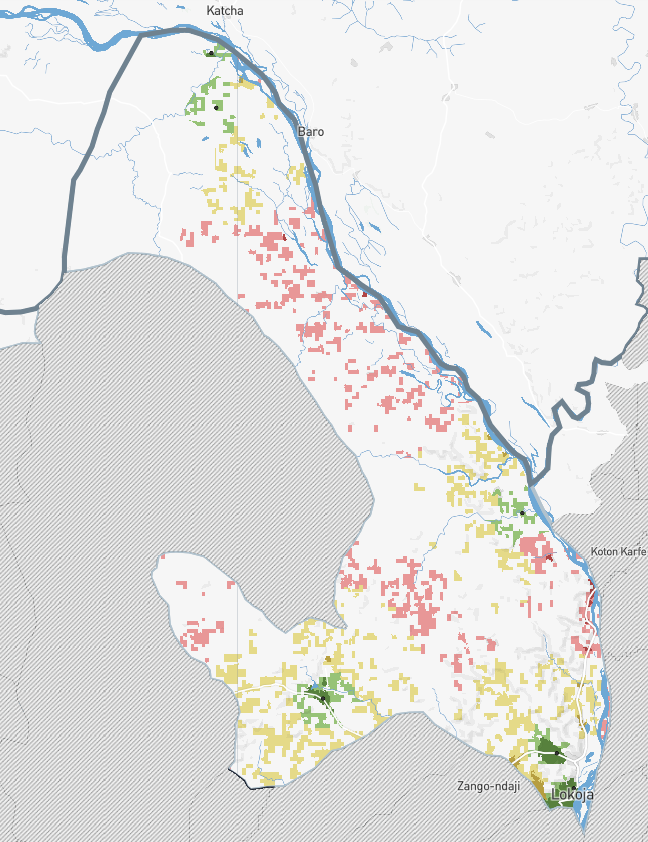
For the three LGAs combined, we proposed eight additional training centers to cover areas where workers would face long walks. The analysis showed not just where gaps existed, but reveals exactly how the program could fill them.
This was the first time we'd used accessibility analysis to help plan training infrastructure rather than identify service gaps. It’s the same underlying calculation of realistic travel distances and coverage patterns with a completely different application.
Creating supervisory areas with wards
Kogi's supervision structure required something different from Guinea-Bissau or our other Nigeria work. They had five supervisors per LGA and wanted to assign whole wards to each supervisor rather than dividing wards into smaller units.
Our standard fair supervisory areas algorithm uses settlement-based catchments as building blocks. For this work in Kogi, I modified the algorithm to use wards instead. The constraints stayed the same: five supervisory areas per LGA, territories must be contiguous, populations balanced as much as possible.
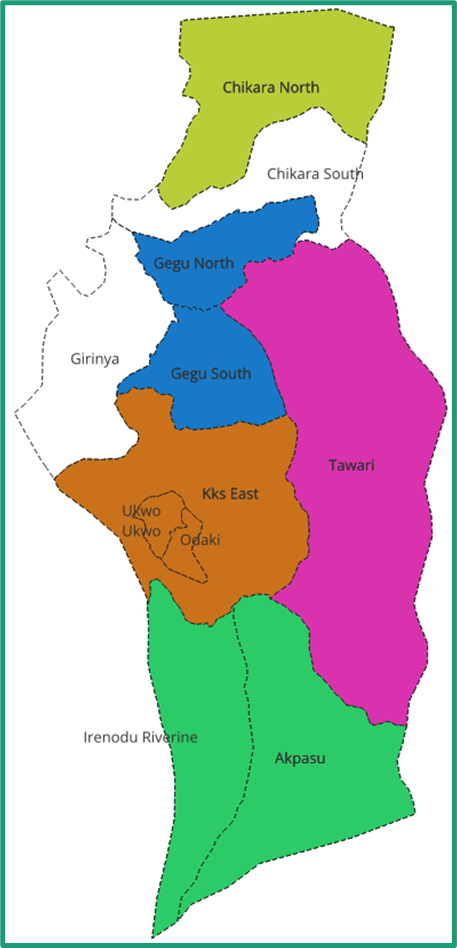
The MOH requested one adjustment after seeing the initial output. Their local knowledge suggested a different grouping for a few wards would be easier to manage operationally. The numbers would be slightly less balanced, but their reasoning made sense and they know this area better than anyone.
This customization work sits outside the standard tool settings. Right now, I run the modified algorithm locally when teams need ward-based divisions. Whether we build that as a new setting depends on seeing more demand for this approach. Custom support works for now.
When planning parameters change
The campaign scope changed during our planning. I'd set up the ESPEN Geospatial Microplanner for all of Kogi, originally covering schistosomiasis and soil-transmitted helminths (STH). As planning evolved, we trimmed down to three LGAs focusing on schistosomiasis only.
To adapt the dashboard, we created a custom toggle in the visualization settings so teams could switch between views showing schisto-endemic areas, STH coverage, or both diseases at once. When the scope changed, they adjusted the view to show only what remained relevant. Areas endemic for schistomiasis stayed in scope. Non-endemic wards dropped out.
That kind of mid-planning scope change typically means redoing analytical work from scratch. The ability to adjust views and regenerate analyses meant changes took minutes instead of days. Campaign parameters shifted, maps shifted with them, and there weren’t any big delays.
Directing supervision during campaigns, not just after
We're developing an integration between Crosscut and CommCare (and other data collection tools), the mobile data collection platform Sightsavers uses in Kogi for supervision visits. The integration will extract supervision data daily and automatically refresh the gap analysis view.
Campaign leaders can see coverage evolve day by day instead of analyzing what happened months after a campaign ends. On day one, most of the map shows red. As supervisors visit communities, those areas turn yellow, then green. If gaps start forming in unexpected places, leaders can redirect supervisors before the campaign ends.
Better supervision coverage during campaigns leads to better drug distribution coverage. Right now, teams plan based on last year's data and hope the gaps get filled this year. Real-time monitoring lets them see gaps forming and respond while there's still time to fix them.
This integration is still being developed, but it represents where monitoring is headed across country projects. The goal isn't just better maps. It's closing the loop between planning, seeing what's actually happening in the field, and adjusting while it still matters.
Ongoing monitoring and evaluating
These projects feed directly into our monitoring and evaluation framework. We're not just measuring whether teams use the tools. We're tracking whether supervision coverage actually improves in targeted communities, whether training infrastructure reduces worker travel burden, whether balanced supervisory areas lead to more consistent oversight.
The real-time CommCare integration will make that measurement more immediate. Instead of comparing this year's campaign to last year's six months later, we'll see coverage patterns emerge day by day. That creates a tighter feedback loop between planning, implementation, and adjustment.
One algorithm, different applications
This country project demonstrates that we can use the same fundamental algorithm in the Crosscut App to solve different planning problems, depending on how you apply it.
Calculating realistic travel distances and coverage patterns works for identifying supervision gaps. Adjusting the threshold makes it work for training center placement. Changing the building blocks from settlements to wards makes it work for different supervisory structures. Same underlying approach, different parameters, different applications.
Not every customization needs to become a permanent feature. Some work better as specialized support for specific contexts. That flexibility is a feature when MOH and partners in other regions or countries have entirely different planning structures and demands.
If your organization is preparing for health campaigns and needs support with supervision planning or territory management, reach out through our Advisory Services.
Related Posts

How the Crosscut App helps plan health campaigns in Nigeria

An independent evaluation of the Crosscut App
.JPG)

How to set up a Microplan Collector project in the Crosscut App
