
Measuring Impact: Inside Our M&E Framework

We’ve spent a lot of time building tools to help improve geospatial health campaign planning – and just as much time figuring out how to measure whether they’re actually making a positive difference in the world.
That’s where our monitoring and evaluation (M&E) framework comes in. It’s not something we built just to check a box. We put real time into it, pulling from international standards and adapting them to the way our software works and the kinds of decisions our users need to make. It’s designed to connect what we’re building with what actually happens on the ground.
This post outlines our M&E approach for the Crosscut App: what it measures, how it works, and how it’s making our catchment mapping system more useful, responsive, and grounded in real-world conditions.
What is M&E and why do we use it?
Monitoring and Evaluation is how you check whether something’s working as intended. It gives you structure around what to measure and what to learn from your work. In our case, monitoring and evaluation is everything we do to grasp whether the Crosscut app is helping teams plan more effectively and reach more people.
If you work in global health or international development, especially in areas like immunization or neglected tropical disease programs, you already know how central M&E is to project accountability and learning. For us, it’s how we check if we’re on track and stay honest about what we’re contributing to.
We use it for internal accountability but also because funders want to see that a tool has a plausible path to impact and a way of proving it out. Implementing partners want innovative tools that make campaigns easier to run and more effective. And users in the field need to know whether something is helping them work more efficiently – or just a shiny new thing that doesn’t add much actual value.
This M&E framework is how we try to answer all three of those questions in a structured, testable way.
Our theory of change: mapping the logic
At the heart of our M&E framework is a Theory of Change (ToC) – a structured way to explain how and why we expect our tools to lead to impact.
A Theory of Change answers a deceptively simple question: “If we do X, how will it lead to Y?” It lays out the chain of logic from input to output to outcome, clarifying what we expect to happen, what assumptions must hold, and how we’ll know we’re on track.
Our ToC maps out how our app’s core features, like creating catchment area maps or collecting microplans, lead to short-term results. That might mean better planning clarity about which communities fall within specific catchment areas or less doubling up on services. The model then traces how those outputs contribute to broader program-level outcomes, like more communities reached or fewer delays, and eventually to long-term changes in how health campaigns are run. Here's a simplified view of how this works:

This diagram traces how specific Crosscut features lead to specific improvements in health program delivery. Though global health isn’t the only use case, here’s an example:
- Catchment maps clarify team zones → fewer missed or double-treated areas → higher treatment coverage
- Travel time analysis highlights underserved zones → better campaign planning → more communities reached
- Shared microplans → more accurate population estimates → better supply forecasts and cost-effective operations
This pathway does rely on a few key assumptions: Campaigns need to run on schedule. Partners need to actually use the maps. Teams need to coordinate effectively. We’ve built those assumptions into the model and use them to guide how we interpret the data we collect. We also constantly revisit them and track whether they’re holding up in real conditions.
The full theory of change maps the entire chain, from app-generated outputs like maps and microplans, to program-level outcomes, to the long-term impact we’re contributing.
How we use M&E to test the model
The value of using a Theory of Change is that it gives you something concrete to test. M&E is what helps us turn that into a working system.
We’ve linked our indicators to the outputs and outcomes defined in the model. Some of those indicators are standard – like treatment coverage or number of communities reached. Others come from inside the app itself. When someone generates a map, submits a plan, or takes a key action, that event is logged.
This gives us specific, timestamped data of user behavior that is anonymized and aggregated so we stay as close to the source as possible. The app itself is part of the evaluation system by giving us real-time insight into whether our tools are being used as intended and contributing to the outcomes we expect.
What we measure – and why
Beyond the expected outcomes, we evaluate each major feature through four key criteria:
- Scale – Are people using it? Where and how often? Indicators include the percentage of specific areas with catchment maps generated using the tool, the number of enriched maps retained, and engagement metrics like number of visits
- Efficiency – Is it saving time or reducing effort? We measure this through user surveys comparing the time required for microplanning before and after using our tools.
- Difficulty – How easy is it to learn and adopt? We track the percentage of users who can use our tools without external assistance.
- Reliability – Does it consistently produce high-quality outputs? We evaluate by asking actual users whether they find the outputs reliable, again via pre/post surveys
These dimensions give us another lens for understanding performance. They help us identify not just what’s being used, but how well it's functioning in practice from one user to another. One example is our accessibility heat map, which translates planning data into a visual format teams can use to spot gaps and adjust coverage as needed.

Feedback from the field
In addition to usage logs, we’re rolling out more structured user feedback within the app itself. This includes short in-app prompts to track how users perceive reliability and difficulty, plus tools like Net Promoter Score surveys and quick follow-ups after submitting a plan.
For our 2025 country projects, we will also be conducting qualitative interviews and before/after measurement of the key outcomes of target population accuracy, expanded health campaign treatment coverage, and more communities reached with health services.
This kind of feedback helps us fill in the gaps that usage data alone can’t explain. Like our population benchmarking feature that evolved directly from feedback from teams in Ghana, many of the features in the current app, from how catchment areas are visualized to how microplans are submitted, reflect what we’ve heard directly from clients and users in the field.
Why this work matters (to us)
This framework is the result of months of careful internal work coupled with multiple reviews from M&E experts in the global health technology field. We reviewed documentation, aligned and re-aligned on goals, tested indicators, and learned a lot from early deployments.
We took those extra steps to move beyond assumptions. We’re not just trying to show that the work matters, but to understand how and when it does. The system gives us a foundation for learning, and the structure to make decisions that are grounded in data and experience.
There’s still more to build. But we believe this approach puts us in a better position to keep improving what we offer and to support the people using our app to do work that really matters.
If you're looking to strengthen your planning or evaluation work, the Crosscut App is free to use. We’re always interested in hearing how others are approaching their M&E strategy.
Related Posts

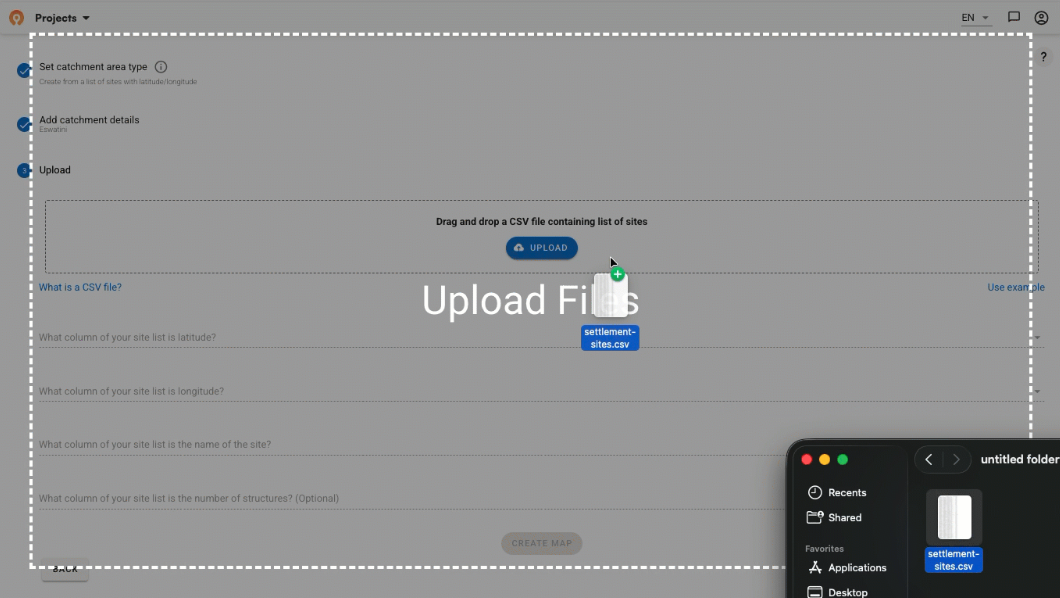
How to set up a Microplan Collector project in the Crosscut App

May 2026 updates: Shared microplan projects and easier supervision analysis

How to find the communities your health campaign is missing
.JPG)
