
Supervisory areas and printed maps in Guinea-Bissau
We recently worked with Guinea-Bissau's Ministry of Health and Sightsavers to prepare for an mass drug administration (MDA) campaign that took place in October. The work focused on two regions, Bafatá and Gabú, where we created balanced supervisory areas for cleaner oversight coverage.
Like our recent work in Nigeria, the teams analyzed the previous year's supervision data to identify coverage gaps using the ESPEN Geospatial Microplanner, which is the version of the Crosscut App available in WHO's ESPEN portal. But Guinea-Bissau also had extra work: dividing large health facility catchments into balanced supervisory areas before the campaign started.
The supervision structure
During MDA campaigns, community drug distributors (CDDs) go door-to-door delivering treatments. Supervisors verify that work by visiting communities, checking in with CDDs, and sometimes interviewing households directly. There’s typically about eight CDDs per supervisor, though that shifts with population, terrain, and team structure.
How you organize supervision depends on how many health facilities cover a specific area. In Nigeria, creating simpler site-based catchments around health facilities worked as supervision zones. These areas had facilities more spread out, so each facility catchment was smaller with typically one supervisor per facility. The facility catchments themselves worked as supervision zones.
Guinea-Bissau had fewer facilities covering much larger areas. Each facility catchment included 10 to 30 supervisors with sizable travel distances between individual communities. Those facility catchments were too large to serve as supervision zones. They needed to be divided further.
That's where our fair supervisory areas algorithm came in, creating smaller balanced territories within each facility catchment.
Spotting supervision gaps
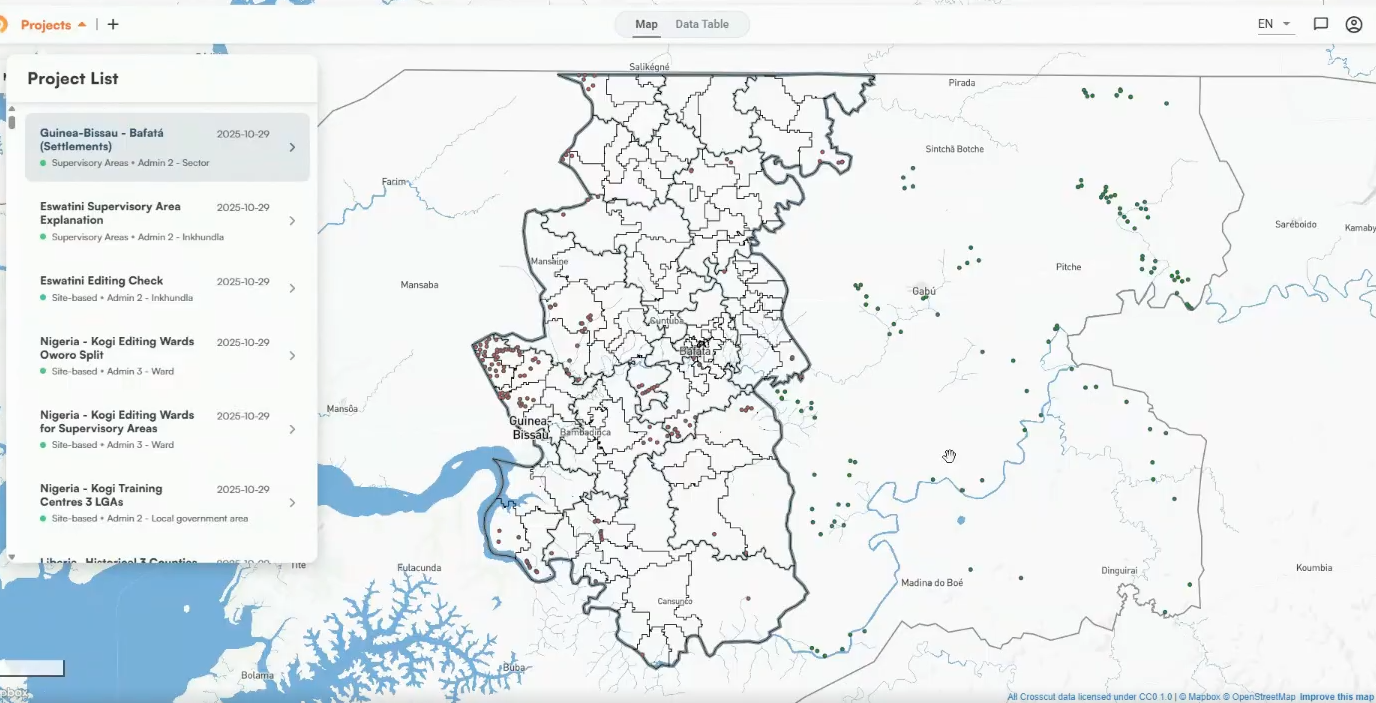
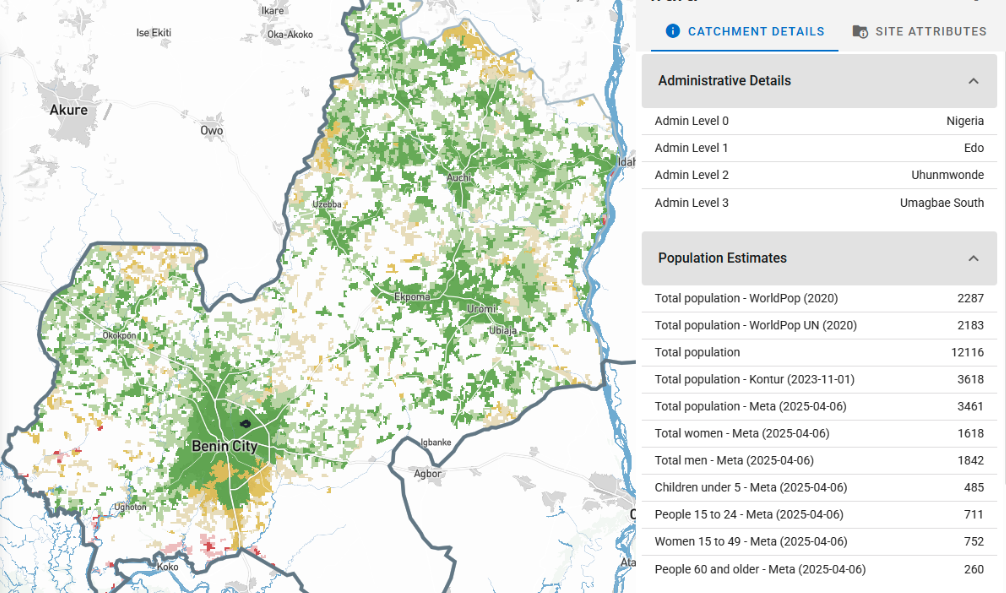
We started with a supervision gap analysis in the ESPEN Geospatial Microplanner, similar to what we did in Nigeria. The teams analyzed data from the previous year's campaign to identify communities supervisors hadn't reached. Those priority areas became the supervision targets.
The Sightsavers team then built a Metabase dashboard using data exported from our tool to track the campaign. Triangles marked the priority communities we'd identified. Circles showed actual supervision visits during the campaign. Together, they showed whether coverage was improving in the right places.
Creating fair supervisory areas
The Ministry of Health and Sightsavers provided data showing how many CDDs and supervisors worked in each health area. We used that to set the parameters: supervisor-to-CDD ratios and target population per CDD (usually between 250-400 people depending on how spread out communities are).
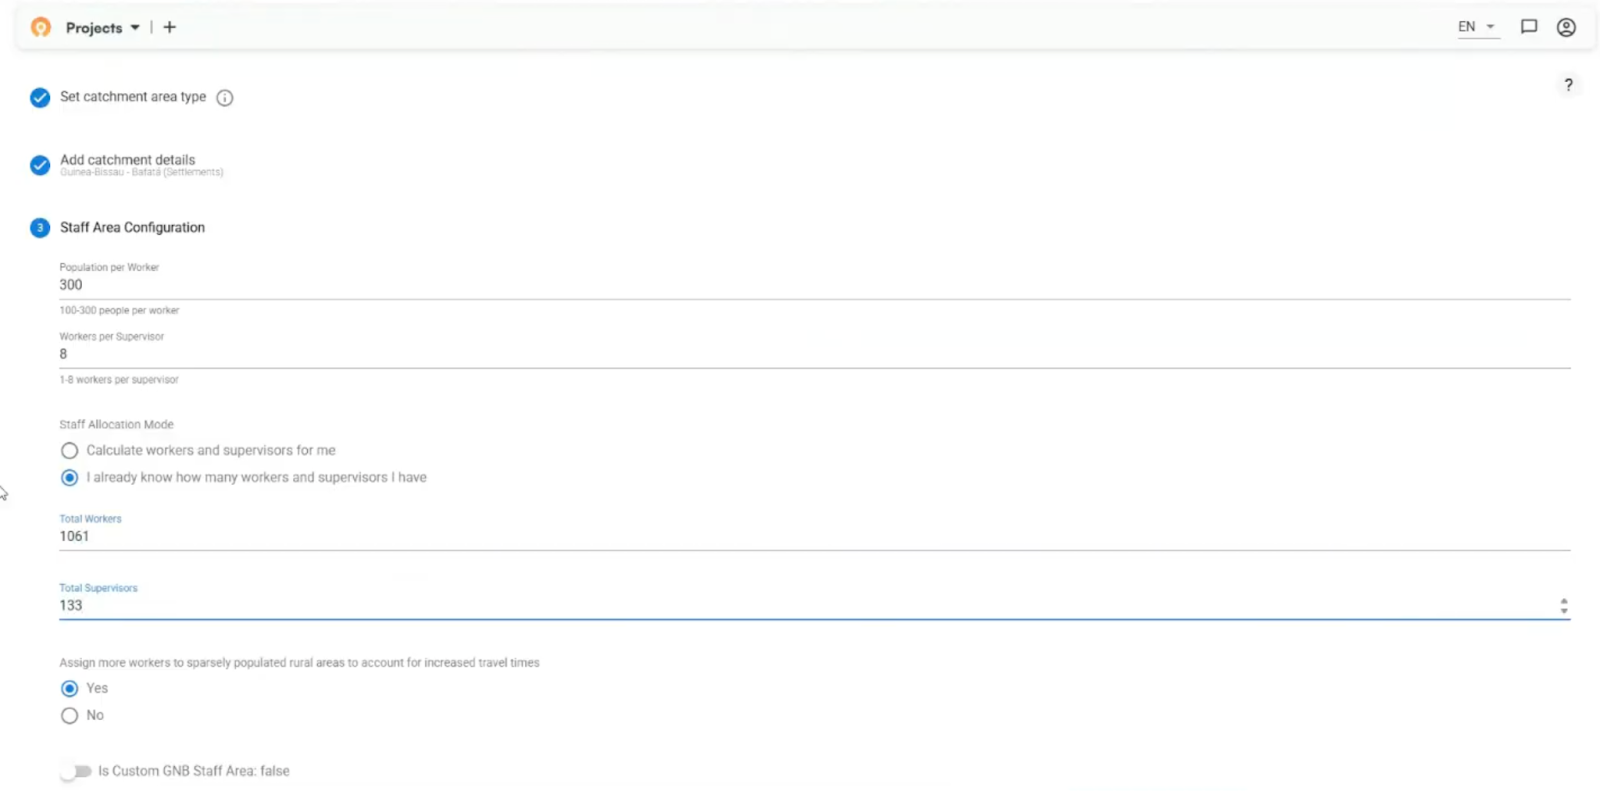
The algorithm automatically carved up each health facility catchment into supervisory areas based on these ratios. It grouped settlement-based catchments together while keeping territories contiguous and balancing population across supervisors.
The algorithm also factored in realistic travel time, not just straight-line distance. A community 10 kilometers away could be an hour's walk or several hours depending on terrain and barriers like rivers. These overlays help the field teams spot any potential issues.
Supervisors working near the health facility might oversee 8 CDDs, while those covering distant rural areas might only manage 6 because they spend more time traveling between communities.
Refining with local knowledge
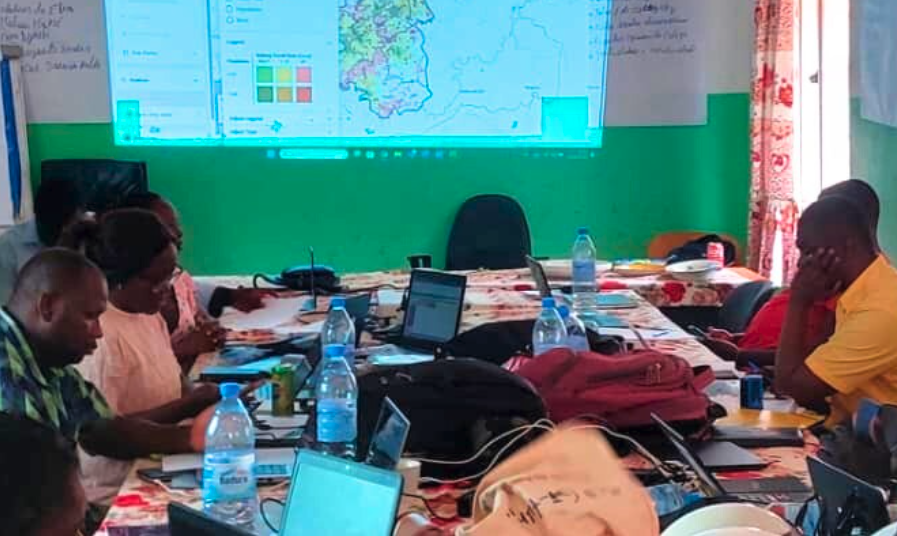
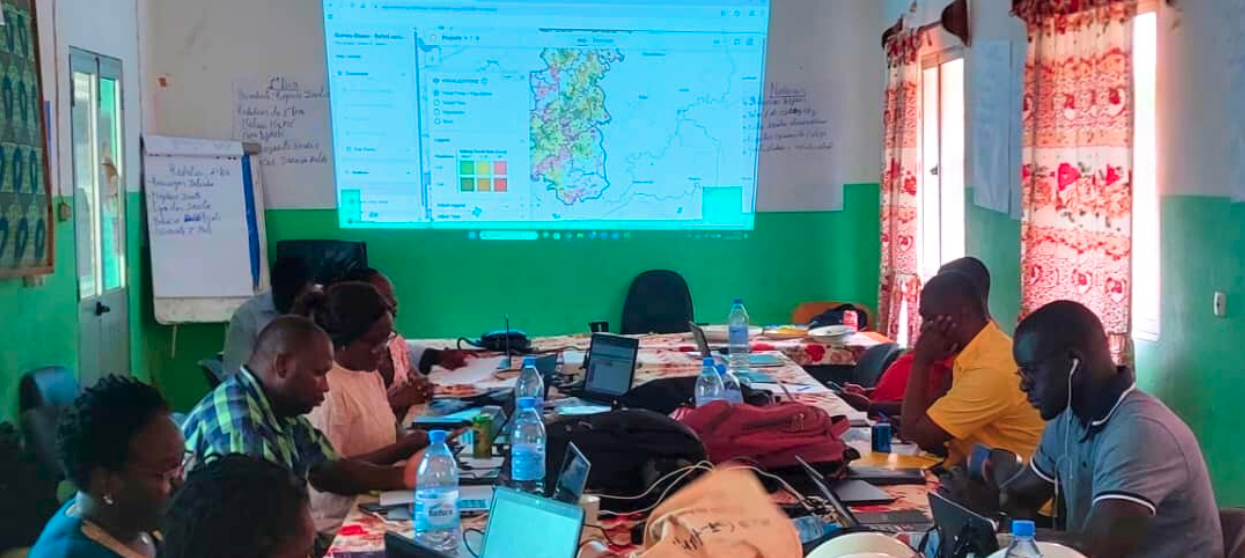
After the edits, we printed the maps for training sessions in Bafatá and Gabú. In past campaigns, supervisors sketched these areas by hand on blank paper during the last day of training. Now they had printed versions with boundaries drawn, landmarks indicated, and supervision targets from the gap analysis.
Printed maps with QR-coded feedback
Each printed map showed a supervisor's territory with boundaries, roads, health facilities, and supervision targets (marked as diamonds on the map). The QR code in the corner was new. We were excited to test whether supervisors could send feedback using their phones.
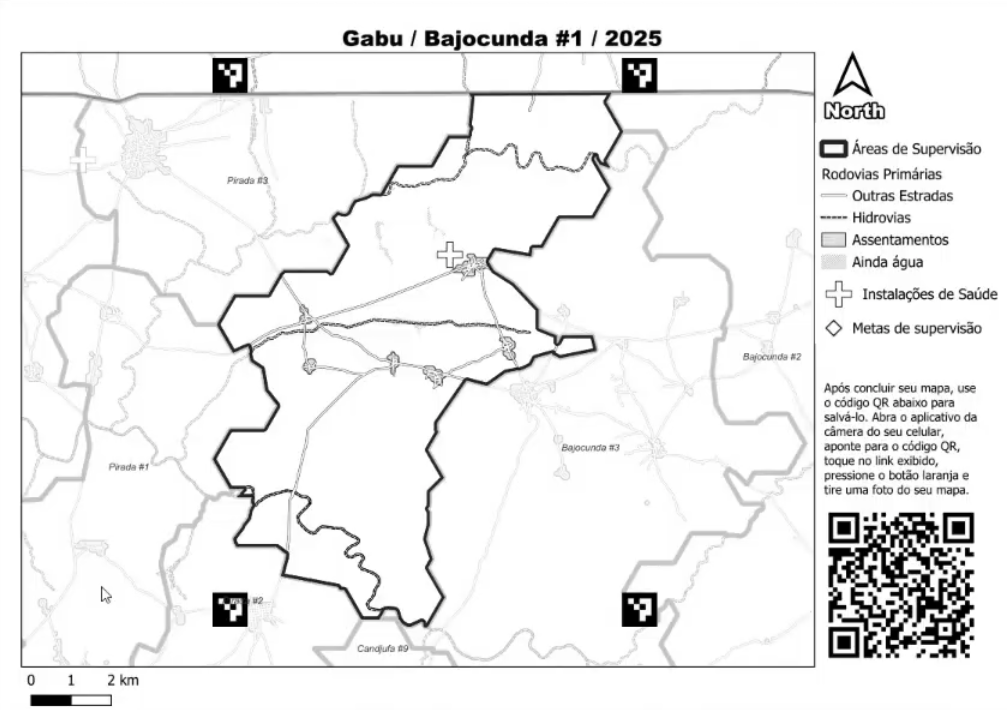
During training, supervisors marked up these maps. They drew CDD territories, noted community names, and highlighted priority areas. Then they scanned the QR code, which opened a form to photograph and upload the marked map. The four corner markers act like anchors, letting us automatically place those photos in the correct geographic position. Supervisors took the marked maps back to their health facilities to coordinate with CDDs before the campaign started.
When maps were uploaded, the technical side worked well. The upload tool connected reliably despite limited connectivity, and georeferencing placed maps correctly with locations marked (diamonds below). What we're still figuring out is the organizational process of setting clearer expectations, what to mark up, and how to work the maps into the normal workflow.

We're also exploring how these marked maps might eventually connect back to monitoring systems like the Metabase dashboard. It's still early and we're figuring out both the technical integration and whether this feedback loop actually helps teams plan better.
Building toward scalable planning
The supervisory areas helped divide large health facility catchments among multiple supervisors. But they also created a foundation for better monitoring. When you have clear territorial boundaries, you can track which areas get checked and which didn't.
This project showed what's possible when we adapt tools to match what teams actually need. The monitoring and evaluation framework we've been developing will help measure whether these balanced supervisory areas improve coverage in targeted communities.
If you're wrestling with similar challenges around supervision coverage or territory planning, reach out through our Advisory Services. We're learning what works across different contexts, and those lessons feed directly into making the tools more useful for everyone.
Related Posts

How the Crosscut App helps plan health campaigns in Nigeria

An independent evaluation of the Crosscut App
.JPG)

How to set up a Microplan Collector project in the Crosscut App
