
Mapping Health Boundaries Where None Existed: Schistosomiasis Control in DRC

Disease mapping in remote settings has always been about making the best of what's available. When we carry out schistosomiasis surveys in places like the Democratic Republic of Congo, we're trying to figure out where people need treatment so we can plan how to get it to them.
In December 2024, our team at Unlimit Health worked with the DRC Ministry of Health on a mapping survey using model-based geostatistics (MBG). While MBG is more cost-effective than other survey methodologies, it requires geographical data to select study sites and for MoH to make treatment decisions. We tested for schistosomiasis at coordinates across the country and used that data to predict infection levels across the region, producing maps showing disease probability that look similar to a heat map.
The WHO control strategy calls for treating areas where infection exceeds 10% with praziquantel (PZQ). But you can't tell field teams to "go treat the red areas" without named boundaries and locations they can actually find. We need to be able to tell field teams which village or school in which health catchment area to go to, rather than simply providing a list of coordinates for them to follow. What we had were rough sketches drawn by local health officials.
Despite their rough appearance and different naming conventions from one region to another, these hand-drawn maps contained local insight that no digital map could offer. The key was anchoring these sketches to our existing GPS data to create boundaries that matched reality on the ground.
You can't tell field teams "go treat the red areas" without named boundaries and locations they can actually find. We need to tell field teams which village or school in which health catchment area.
The common challenge (with uncommon complexity)
In DRC, like many neighboring countries across sub-Saharan Africa, health catchment area boundaries have never been digitized. That means we often have to build them from scratch.

Getting the boundaries wrong means that areas around treatment thresholds get misclassified. People who need treatment might not get it, while others receive unnecessary medication. For a disease like schistosomiasis that affects 240 million people globally, and with DRC showing 55.8% prevalence among school-aged children, precise boundaries that health teams can actually use and share translate directly into better outcomes.
The research above is from 2023, and it's already behind because reliable, current data in these regions is hard to come by. Where health area boundaries do not exist, the time and effort required to plan, conduct, and interpret the results of a mapping survey increases exponentially. This spotty, inconsistent data availability is exactly the problem we're helping to solve.
Some of the alternatives include assigning treatment decisions at the wrong level of implementation or skipping the mapping survey entirely. This worst-case scenario has huge implications on control of schistosomiasis as countries are unable to request medicine from WHO without data. Where digitised boundaries already exist, such as in Zimbabwe, the MoH can get an accurate picture of the current infection levels and make informed decisions targeted at each health catchment area. Those boundaries did not exist at the onset of this project.
Working with hand-drawn maps and GPS coordinates
In DRC, building boundaries without official maps required us to work with whatever data we could get our hands on. For this project, we assembled the resources that were available:
- GPS coordinates for health centers (each serves a catchment area)
- Official village lists from the country’s published data
- OpenStreetMap data with reference points like railways, cemeteries, airports
- Hand-drawn health zone maps from zone heads or department heads
The hand-drawn maps were the most intriguing resource because they contained the most recent updates from local contributors actually living or working in these areas. However, these varied dramatically in quality. Some were reasonably accurate representations of geography. Others appeared to be someone's interpretation of spatial relationships, clearly not based on true geometry, but on their understanding of how places connected to each other.
Even with limitations and inconsistencies, these maps were a main focal point. They consistently contained key landmarks that we could cross-reference with OpenStreetMap data and other digital sources using tools like QGIS. What we found was that even rough sketches captured key spatial relationships that we could utilise. The challenge was converting this mix of digital and analog data into something we could actually work with.
Turning local knowledge into usable boundaries
In order to convert the hand-drawn maps into a data layer we could use, we used the Crosscut App to generate usable map boundaries. We started with the GPS coordinates of health centres supplied by the MoH, and dropping pins directly where the coordinates were erroneous or missing. This setup ensured that each health area was represented.
Crosscut helped us generate catchment areas around these points using travel patterns and population data. Then we had to sense-check these results against what we knew from local sources. Do these generated boundaries and size make sense given what local officials had drawn? Do the major landmark features align between data sources?

We used well-known local railways, cemeteries, and airports as main anchor points. These were features that appeared on both hand-drawn maps and in OpenStreetMap data. Working between Crosscut and QGIS, we could verify that railways ran through the areas both sources showed and that cemetery locations aligned between data sources.
When Crosscut's boundaries didn't align with the MoH’s information, we refined the input data to include coordinates of villages by cross-referencing the country’s official village list with OpenStreetMap’s database. This conservative approach avoided including villages that might have been renamed or no longer existed. Dropped pins of landmarks such as railway stations and airports were also added. This gave us more data points per health area to input into the CrossCut app, which regenerated boundaries that were closer to what the local maps showed.
Later, we learned that Crosscut had built-in boundary editing features that could have made some of these adjustments more convenient. The team ended up using some of our feedback from this work to make those editing tools more obvious and discoverable to future users.
Named areas for targeted treatment decisions
The process we used here delivered exactly what we needed: named, bounded health catchment areas where treatment decisions could be made with confidence. Each area had a clear identity, population estimates, and alignment with how health services actually function.

When you know exactly which health catchment areas belong to which treatment zone, you can ensure people who need medication get it, while avoiding overtreatment where it's not necessary. The precision prevents misclassification problems that can occur around decision thresholds. This is a common issue when boundaries are not defined.
The work reinforced something we see across different mapping projects: countries where sub-district borders already exist in digital form require much less preparation. Having clear administrative boundaries available upfront dramatically reduces the complexity of everything that follows.
In DRC, the province for which Crosscut was used to generate boundaries had little to no representation in many open-access databases as high-risk areas are often left out from mapping exercises due to logistical and safety reasons. The Crosscut App presents a novel solution to close the gap between feasibility and need for updated data on schistosomiasis infection at a sub-district level.
Similar challenges across sub-Saharan Africa
DRC isn't unique in facing this challenge. Across much of sub-Saharan Africa, the smallest administrative units have never been digitized, or official maps are out of date. Some organizations now require sub-district shapefiles before beginning surveys.
We've seen this with trachoma control initiatives. For example, in the Ascend Programme where teams won't even start planning mass drug administration campaigns without digital boundary files showing exactly which areas each team will cover. Without these files, there's no way to ensure complete coverage or avoid treating the same areas twice.
The missing boundaries become a bigger problem as health programs move toward more targeted interventions. Instead of broad district-wide decisions, we want to identify specific health catchment areas where transmission is high and focus resources there. But granular targeting depends entirely on having the geographic data and precision to support it.
Traditional GIS workflows for building boundaries that don’t already exist require specialized mapping expertise (or resources) that many field teams simply don't have. This approach works with digital tools and local knowledge that most health programs are already using.
Making the most of imperfect data
The boundaries we created aren't legally perfect administrative divisions, but they work for organizing treatment campaigns and allocating resources. What mattered was that health teams could use them to know exactly which villages in which health catchment areas they were responsible for and who needed help.
Our approach was to start with the best digital tools available, then validate with all the local knowledge and sketches. In DRC, that meant combining Crosscut's algorithm with hand-drawn maps and cross-checking landmark locations through QGIS.
Working with limited data means finding creative ways to verify and cross-check results. The hand-drawn maps in DRC weren't precise, but they contained spatial knowledge we couldn't get anywhere else. Sometimes the most valuable data comes in the most unexpected formats.
Learn more about Unlimit Health's work on schistosomiasis elimination and neglected tropical diseases.
Related Posts
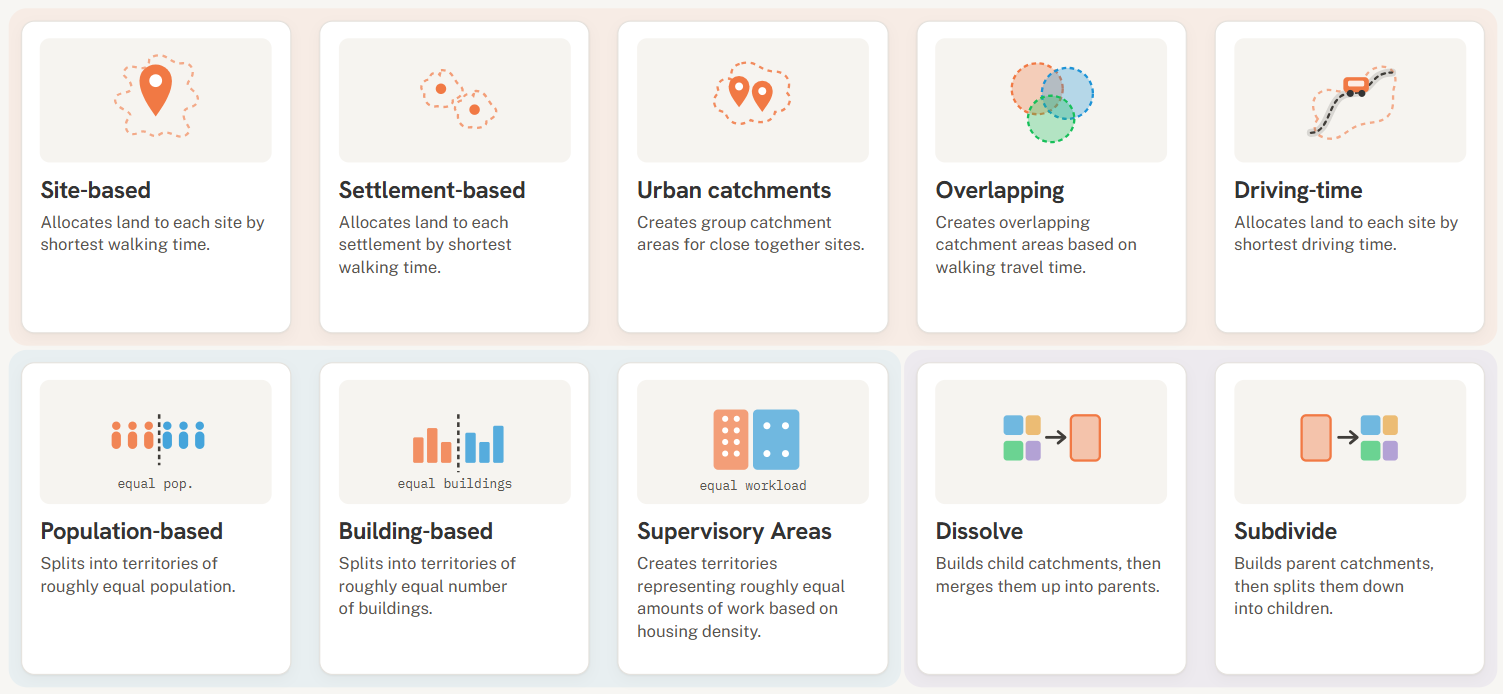
Choosing the right catchment area mapping method in the Crosscut App

DHIS2 Annual Conference 2026
.JPG)

How to create catchment area maps in DHIS2 with the Crosscut App
