
Mapping Oncho Transmission Zones in Burundi

Burundi’s Ministry of Health reached out last year to help update their endemicity map for onchocerciasis (river blindness) most of which was labeled as “unknown prevalence."
Without knowing where transmission was actually happening, it is hard to plan mass drug administration treatment campaigns. Some communities might be missing treatment, while others could be receiving medicine they no longer need.
Using prevalence survey data collected in 2018 and 2023, we worked alongside the Ministry to turn those unknowns into something actionable. This work was supported by Christian Blind Mission,
In October, Clara Burgert-Brucker and I presented the results to Burundi's Ministry, pharmaceutical partners who supply treatment, and implementing partners. It was well worth a 3am wake-up on my end to walk through what we found.
Moving beyond administrative boundaries
Burundi’s previous ESPEN map classified entire districts under a single category that left much of the country labeled as “unknown prevalence” (orange) in the national ONC elimination program dashboard. Planning campaigns at the district level also lacked specificity. A single district might contain both high-risk communities still needing treatment and low-risk areas where transmission has already been interrupted.
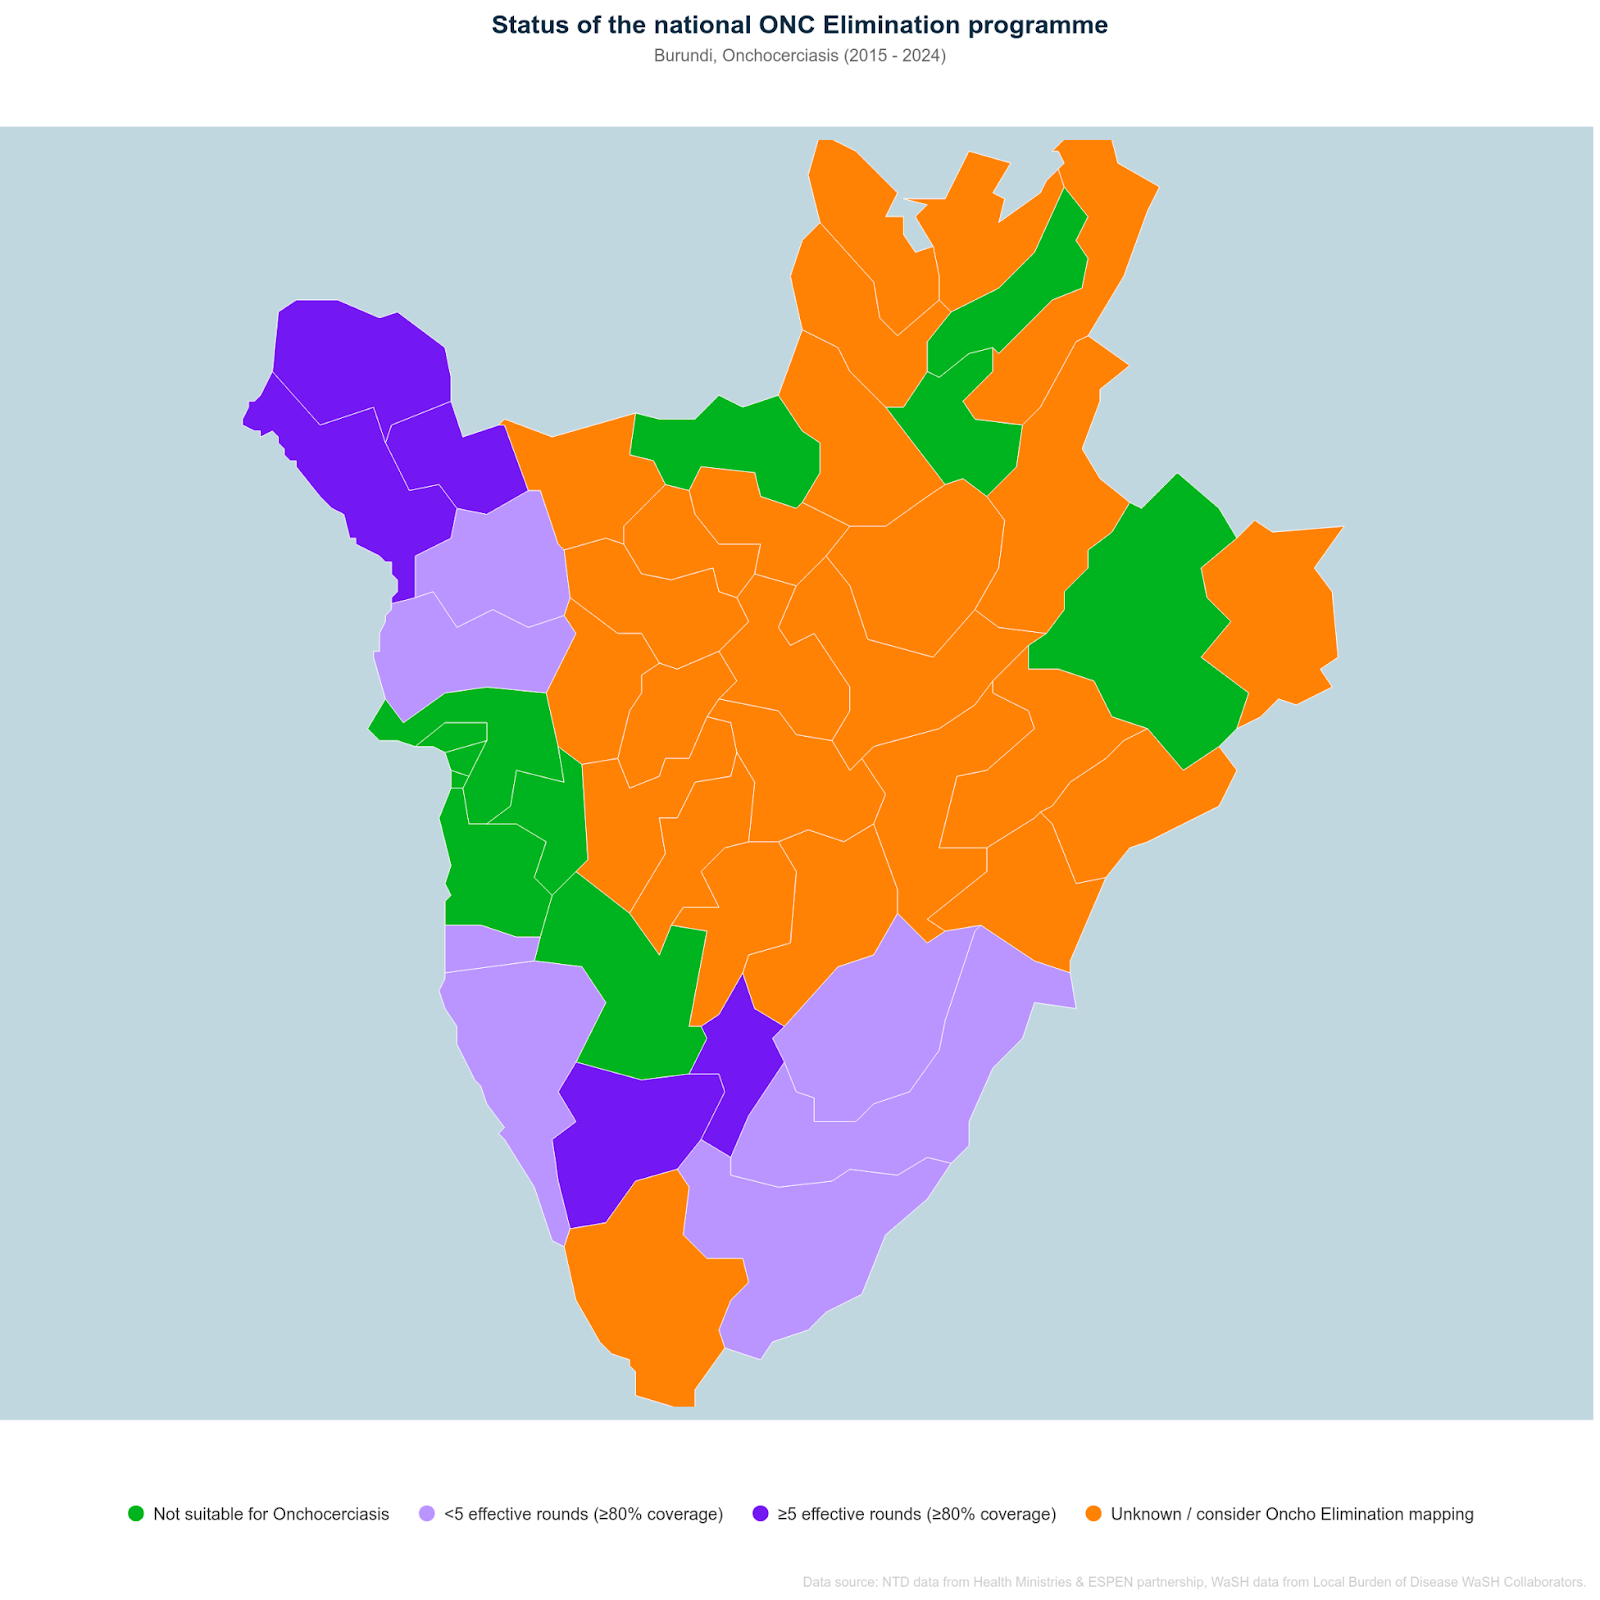
The Ministry wanted to make decisions all the way down at the colline level, their smallest administrative unit. With more than 2,500 collines nationwide, that level of detail avoids wasting medicine or services in low-risk areas while ensuring high-risk communities receive treatment.
Turning survey data into national guidance
The Ministry had about 200 survey locations across Burundi. Useful data, but far fewer points than the number of collines that needed decisions.
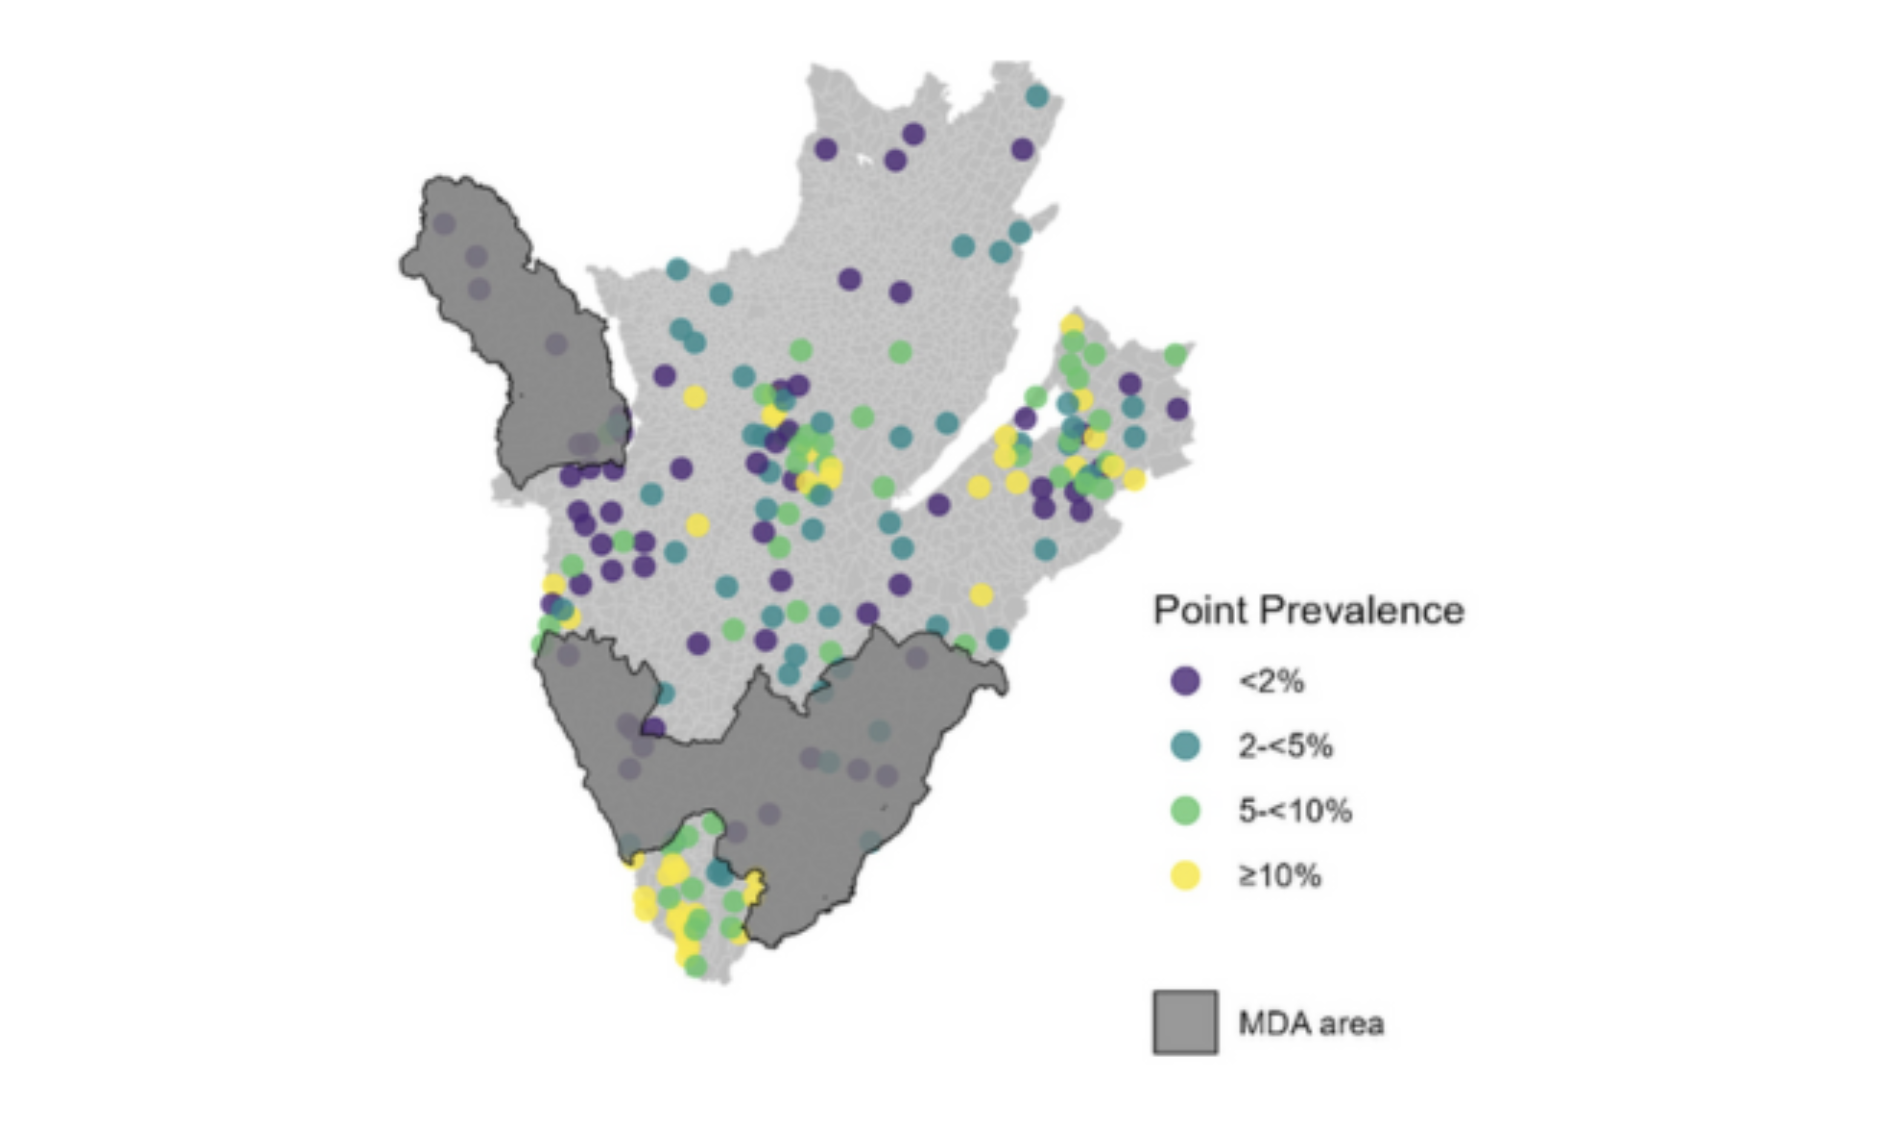
We worked with Locational, a UK company that provides modeling as a service, to combine the survey data with environmental information linked to blackfly habitat, such as rainfall, elevation, and proximity to rivers. Blackflies are the insects that transmit oncho, so understanding where they thrive helps predict where transmission is likely.
The result was a set of maps that estimate:
Map: Predicted prevalence in each colline
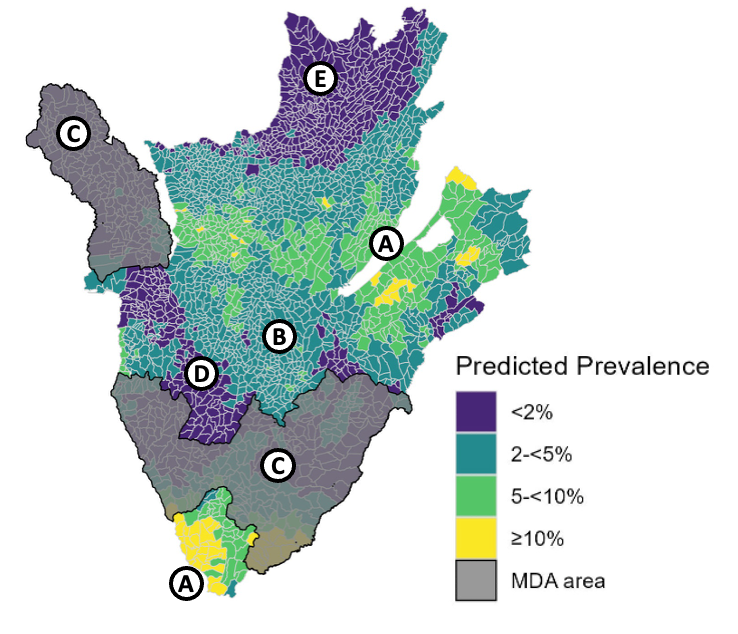
Map: Likelihood prevalence exceeds the WHO treatment threshold

That second map is what really drives decisions. With limited resources, the Ministry needs to know which areas are most likely to require treatment.
What the maps showed
The analysis revealed that transmission is more widespread than earlier administrative maps suggested, especially in central and southern Burundi. Areas that have been receiving treatment for years showed lower predicted prevalence, which is encouraging and suggests the campaigns are working.
Most importantly, the Ministry now has clear categories for action:
- Collines very likely to need treatment
- Borderline areas where more data or prioritization may be needed
- Areas unlikely to require intervention
Instead of “unknown,” they now have a practical starting point for planning MDA activities.
Built into planning, not left on a shelf
The modeled oncho layers are now integrated directly into the Crosscut App. When planning health campaigns, Ministry teams can view predicted risk alongside population and accessibility, depending on the question they are trying to answer.
This kind of analysis is also essential for requesting donated medicines. Treatment programs need clear evidence of where intervention is needed before pharmaceutical partners will allocate resources. The updated transmission maps provide that transparency.
What’s next for Burundi
This project showed how geospatial modeling and catchment mapping can fill gaps when surveys alone leave large areas uncertain. Burundi started with a map full of unknowns. They now have countrywide, colline-level guidance to support real planning decisions.
The Crosscut App is free to use for basic mapping and planning. For programs that need additional support defining transmission zones or planning complex campaigns, our Advisory Services can help.
We’ll share more soon about upcoming catchment mapping and geospatial microplanning work planned for Burundi’s next campaign.
Frequently Asked Questions
Why does the 2% threshold matter for onchocerciasis?
Below 2% prevalence, oncho transmission tends to die out on its own over time. Above 2%, the disease persists in the population even without new introductions. This threshold helps programs decide where intervention is necessary versus where they can safely allocate resources elsewhere. It's not arbitrary. It comes from decades of epidemiological research on how the disease spreads in communities.
How does this transmission zone mapping work without requiring teams to change their tools?
The Crosscut App generates the analysis layers that teams can view directly in the app or export for use in whatever systems they're already using. If a program works in Excel, they can download the data. If they use PowerBI or DHIS2 for dashboards, the boundary files export as standard GeoJSON format. We integrate the modeled layer into the app but teams aren't forced to abandon existing workflows. Read more about how the ESPEN Geospatial Microplanner integrates with existing systems.
What environmental factors affect river blindness transmission?
Oncho is transmitted by blackflies that breed in fast-flowing rivers and streams. Environmental factors like precipitation, temperature, altitude, and distance to water bodies serve as proxies for suitable blackfly habitat. These help predict where transmission is likely even without conducting surveys everywhere. River flow rates would improve the model but that data isn't readily available at national scale.
Can this modeling approach work for other infectious diseases?
Yes. We've applied similar methods for lymphatic filariasis in Haiti, schistosomiasis in Senegal and DRC, and malaria control programs (though not an NTD). Each disease has different environmental correlates. Blackfly habitats for river blindness, water access for schistosomiasis, but the core approach stays consistent. Combining point survey data with relevant environmental factors helps predict where intervention is needed.
What's needed to stop MDA versus starting it?
Starting MDA requires showing prevalence exceeds the 2% threshold, which this modeling addresses. Stopping MDA is more complex. It requires entomological surveys showing no infected blackflies in the area, not just low human prevalence. Those are different types of data collection that this model doesn't replace. The Ministry would need vector surveillance before considering stopping treatment in areas where they've been doing campaigns for 10+ years.
Do programs need GIS training to use these catchment mapping tools?
No. Ministry of Health staff create and edit catchment maps during planning meetings using the Crosscut App interface. The platform handles the complex geospatial analysis in the background. Most teams generate their first maps within an hour of initial training. For specialized work like transmission zone modeling, that requires more statistical expertise which we provide through Advisory Services.
Related Posts
Choosing the right catchment area mapping method in the Crosscut App

DHIS2 Annual Conference 2026
.JPG)

How to create catchment area maps in DHIS2 with the Crosscut App
