
All Sub-Saharan African Countries Now Available in the Crosscut App
%20(650%20x%20366%20px)%20(1).png)
Millions of people across Sub-Saharan Africa suffer from preventable diseases. Figuring out who needs help and where they are on the map is a huge challenge. Without the right tools and data, defining what “enough treatment” really looks like can be a huge challenge.
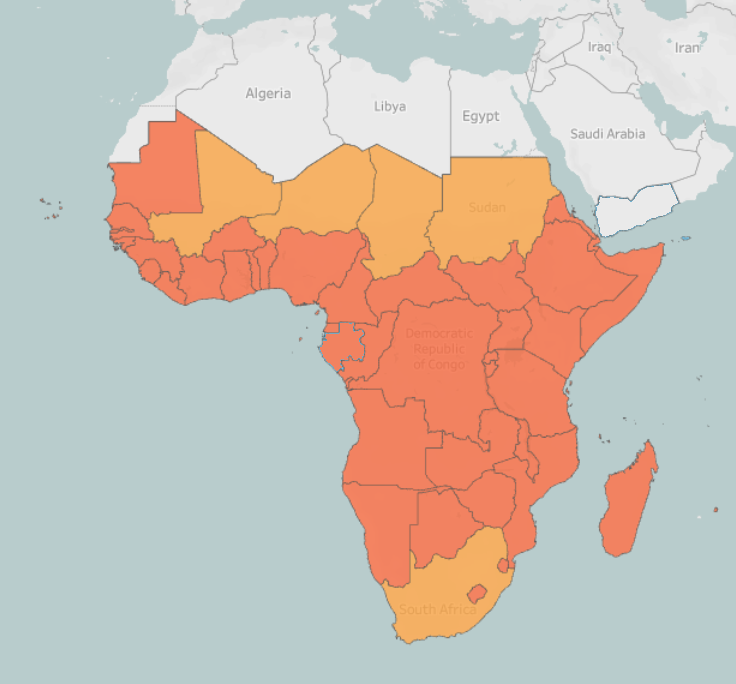
Since 2021, our goal has been to offer fast, free catchment mapping to close this gap for every country in the African region. But adding even one country is a cost intensive job. When WorldPop released new population datasets this year, that gave us the extra push to finish the job. As of today, all Sub-Saharan African countries are now available with their latest data.
We're proud to offer the Crosscut App to more planning teams, and we are proud of the work it took to get here. This article walks through what’s new and how it came together.
What's now available across Sub-Saharan Africa
Every country in Crosscut now runs on WorldPop Global 2 estimates for 2026. The Global 2 dataset represents WorldPop’s first major update since 2019 and is an invaluable resource for planning. Many settlements that were small clusters seven years ago are now much larger communities. Urban areas expanded into farmland, and rural populations shifted. The new estimates capture all those details.
We are also now including Overture as a source for building footprints. Overture consolidates data from OpenStreetMap, the Google Open Buildings project, and Microsoft, then deduplicates. This improves the accuracy of building counts for each catchment area, which is another important metric that is used by health teams planning door-to-door campaigns.
And every country now runs on our hybrid land block system, which snaps to rivers, roads, and natural edges and forms the base layer of our catchment area maps. Land blocks are basically detailed polygons that let catchment area borders align with rivers and roads, which makes them far more usable to health teams.
We want you to try it out. Open the app, click on any Sub-Saharan African country, and you’ll be working with 2026 population data, current roads, comprehensive building footprints, and boundaries that follow real geography.
How catchment area maps simplify planning
Catchment mapping used to mean gathering data, processing everything, and sending maps to a GIS specialist. Field teams would point out problems, “this boundary cuts through a neighborhood.” “That facility serves people across the river.” The GIS person would make revisions, and send new maps back. It took time and cost a lot.
Web-based tools like the Crosscut App are easier. You can create site-based catchment areas by uploading facilities, or use settlement-based catchments to identify where people connect. Accessibility heat maps show which areas are hardest to reach. Instead of waiting weeks for edits, you can edit boundaries with the paintbrush tool.
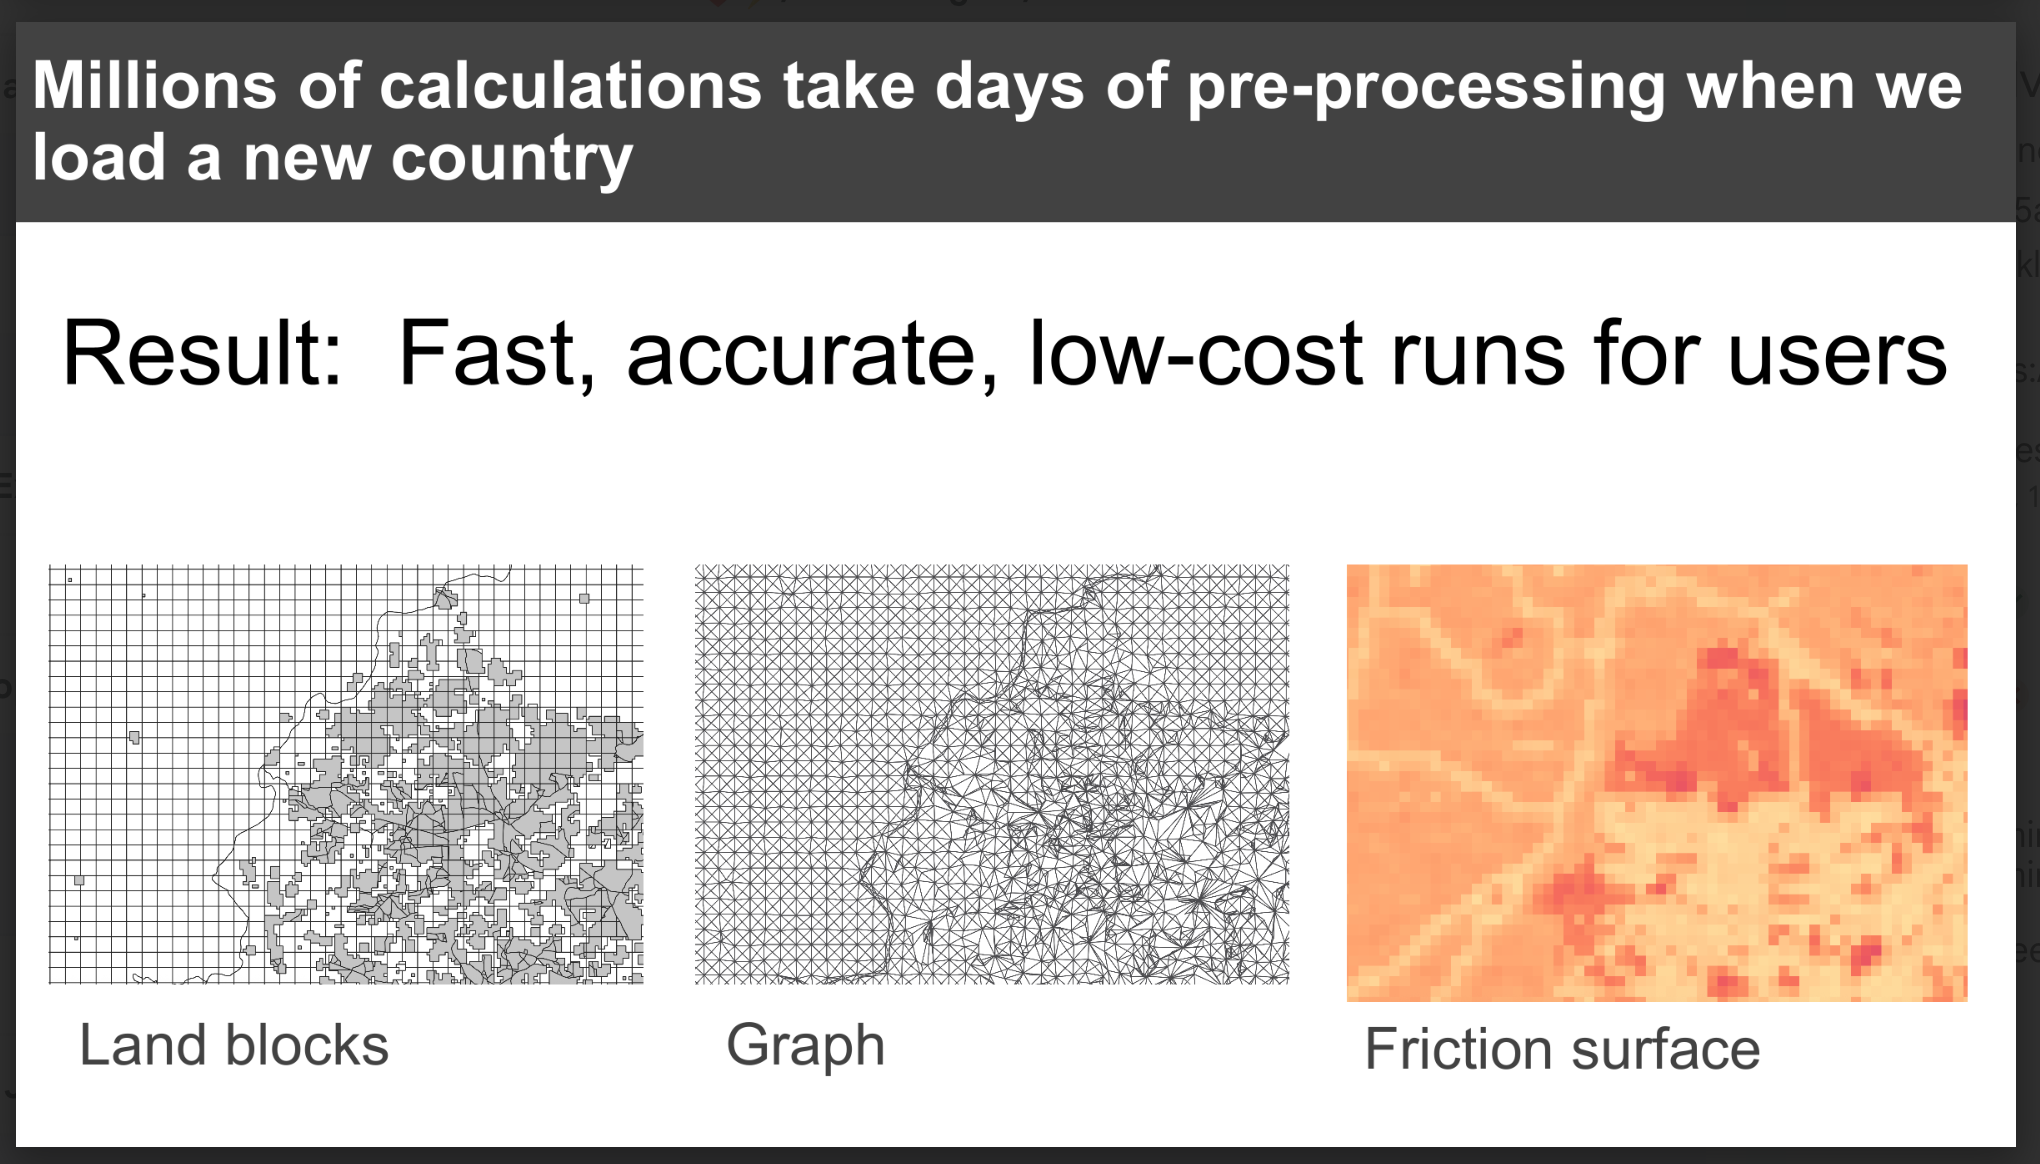
All these layers of data load automatically when you open a country, and the maps stay fast. The heavy computational work happens just once on our end during preprocessing, when we first load a country. You have control to make quick maps and snap decisions without waiting on specialists.
The base layer for instant catchment area maps
To enable loading all countries into our app, we optimized our land blocks to make them very granular in populated places and larger in unpopulated places. That hybrid approach reduced file sizes by more than 60%, which gave us room to add every Sub-Saharan country without crushing site performance. The alternative would have meant massive files that don't work well in areas with limited internet or on older devices, which describes most of our users.
Preprocessing across the continent
Sam on our team managed this preprocessing work across all countries, refreshing countries that were already loaded and added new ones like Angola, Namibia, and several others. Before running geospatial pre-processing, he automatically imports administrative boundaries from governments, road networks from OpenStreetMap, building footprints from Overture, and population rasters from WorldPop.
It takes six geospatial analytical processes to pre-load a country, and a single country can take days to run.
- Land blocks divide it into geographic chunks.
- Friction surfaces calculate travel difficulty, whether you're crossing farmland, forests, or roads.
- Boundary graphs connect abutting areas so travel time calculations work across borders.
- The others embed population data, identify where people group together, and aggregate everything.
Loading all Sub-Saharan African countries was a months-long effort by Sam that had all members of our team contributing at some point. While Sam kept everything moving through this pipeline, Brianna was working on making that pipeline itself more efficient, and Emmanuel was testing each output to ensure everything was working as it should.
Infrastructure upgrades that made this possible
In the past, every time we processed a country, a large factor of the time and cost came not from the code itself, but from waiting for libraries and dependencies to load before we could run our code. Brianna's breakthrough in late 2025 was finding a way to optimize this process, getting our preprocessing code up and running much faster, cutting down the cost and time.
With her changes, one algorithm that took 43 minutes to load previously now finishes in 11. These efficiencies dropped Ghana's complete processing cost by 67%. Combined with the land blocks file size reduction, both improvements made refreshing African countries much more feasible (and affordable on our end).
But Brianna also dealt with outlier cases and individual country quirks. Small island chains where population data doesn't fully cover outlying islands can create incomplete land blocks. Fragmented admin boundaries break assumptions the algorithms rely on. Our January update covered how we handle these edge cases as they pop up.
Free catchment area maps across Sub-Saharan Africa
With this country refresh, we can support more programs in more places. Tools like the ESPEN Geospatial Microplanner and Schisto mapper can operate anywhere in the region now. Teams can set up and deploy real-time maps wherever they need it. And we have the infrastructure to refresh countries annually when new data sources are available.
If you're working on health campaigns, education planning, or service coverage, you can set up a project in a few minutes and get started without having to learn a complex interface. If you’re looking for more support, training, or custom analyses, reach out to us or read more about our Advisory Services.
Related Posts

How to create catchment area maps in DHIS2 with the Crosscut App
.JPG)

How the Crosscut App helps plan health campaigns in Nigeria

