
Smappen vs. The Crosscut App: Which Catchment Mapping Tool Is Right for You
.png)
Smappen and the Crosscut App look similar on the surface. They run in a browser, create catchment area maps from your locations, and have free tiers. The differences show up when you need more countries, more locations at once, or more reliable population data.
Let’s look at where each tool works, what the maps show, and what is actually free.
A Catchment Mapping Overview
Neither tool is trying to do everything. The question is which set of problems matches yours.
Smappen:
- Designed primarily for franchisors, sales teams, and commercial territory management
- Optimized for markets with complete demographic and road data
- Best fit for analyzing store coverage, franchise zones, and sales territories
- Integrates with HubSpot for CRM-connected territory planning and sales teams
Crosscut:

- Designed for coverage planning across networks of facilities or service points
- Works in places where infrastructure and data are incomplete
- Keeps up with how populations shift, not just how they looked a few years ago
- Helps compare different population data sources, not just demographic
- Used across public health, humanitarian planning, logistics, and service delivery
- Integrates with DHIS2, ODK, CommCare, Google Earth, and other planning tools
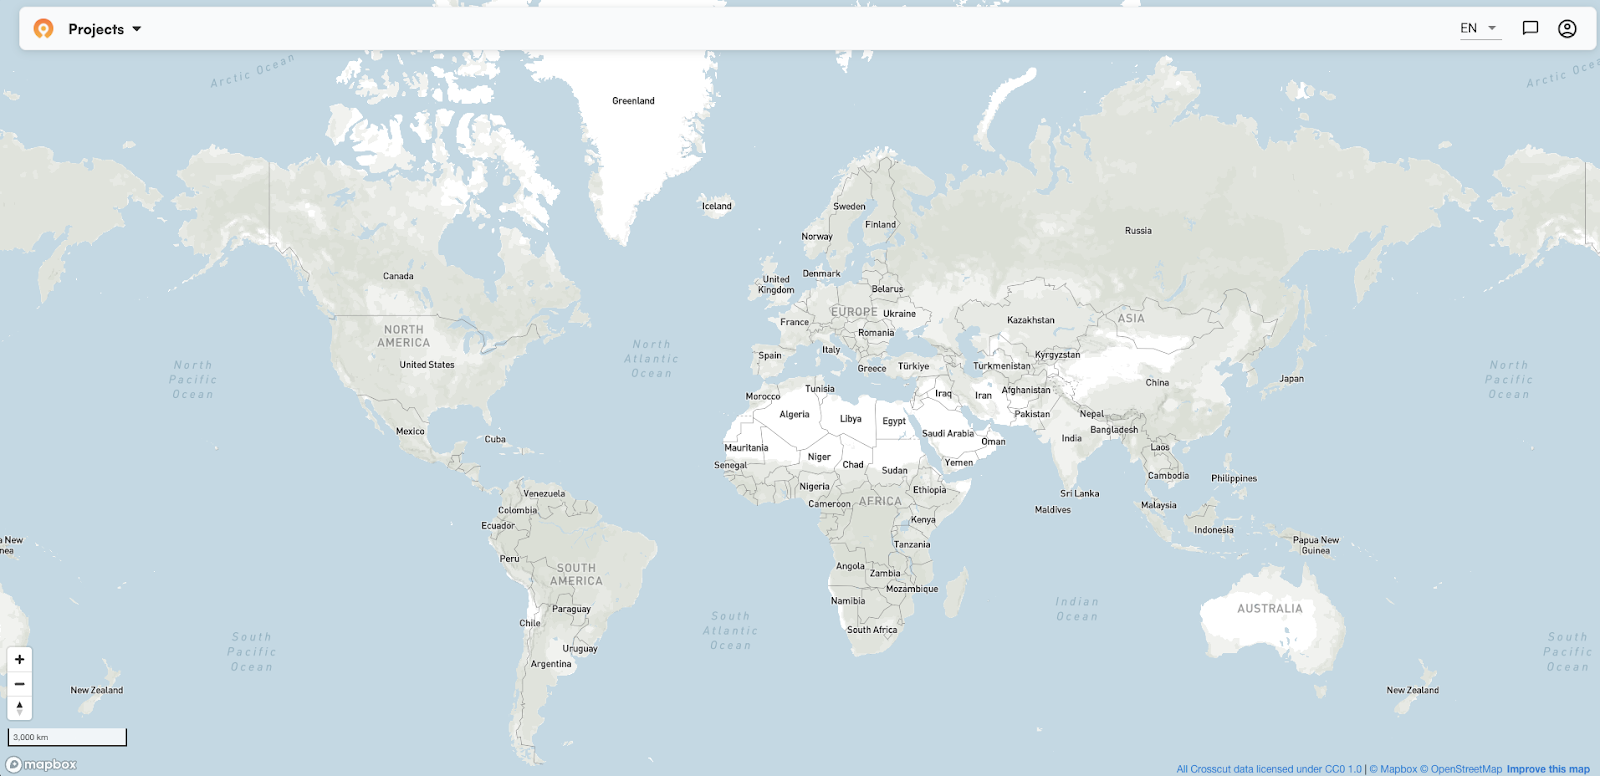
Geographic coverage
Where you’re working will help narrow down these two options and what you need from them.
Smappen:
- Currently works in five countries: France, Belgium, the UK, the US, and Canada
- Boundaries available at state, county, ZIP code, and postcode level within those markets
- Demographic data and admin boundaries are limited or unavailable elsewhere
- Expanding at roughly one to two countries per year
Crosscut:
- Available in 55 countries, with a full 2026 population data refresh
- Covers sub-Saharan Africa, and parts of Asia, Central America, and South America
- Admin boundaries available at country, region, and sub-district level
- Team can add countries for specific projects with enough scope to justify the work
If you work outside those five markets, most of what Smappen offers won't be available to you.
Handling multiple locations
When you map more than a handful of locations, catchments from neighboring points might overlap. That can be a problem if the same population ends up counted in two catchments, and it becomes unclear which location is responsible for which area.
Smappen:
- Builds each catchment independently, so some may overlap with neighboring locations
- Resolving it means applying a Subtract tool to each conflicting pair, one at a time
- With a handful of locations this is manageable, across a large network it adds up
Crosscut:
- Divides the whole region at once so every area belongs to exactly one location
- As a result, there is no overlap and no manual cleanup afterwards
- Works the same whether you are mapping ten locations or a hundred
Reach vs. coverage
Both tools calculate how far each location reaches. The difference is what happens at the edges. Smappen draws boundaries for each location independently, so areas can overlap. Crosscut draws boundaries that divide the whole region among all sites at once, and every area is assigned to exactly one location.
Smappen:
- Each location gets its own independent boundary, drawn outward from that point
- Useful for evaluating a single site, comparing options, or spotting where competitors aren't operating
Crosscut:
- If you have existing locations, every area in the region gets assigned to its nearest location automatically with no gap or overlap
- If you don't have locations yet, the app identifies where people live and cluster, then builds territories around those patterns
- That means you can plan a service network before deciding where to put anything
- Includes an interactive table to compare locations against each other
That second Crosscut approach doesn't exist in Smappen. It changes the planning question entirely, from "how far does this location reach" to "where should a location even be."
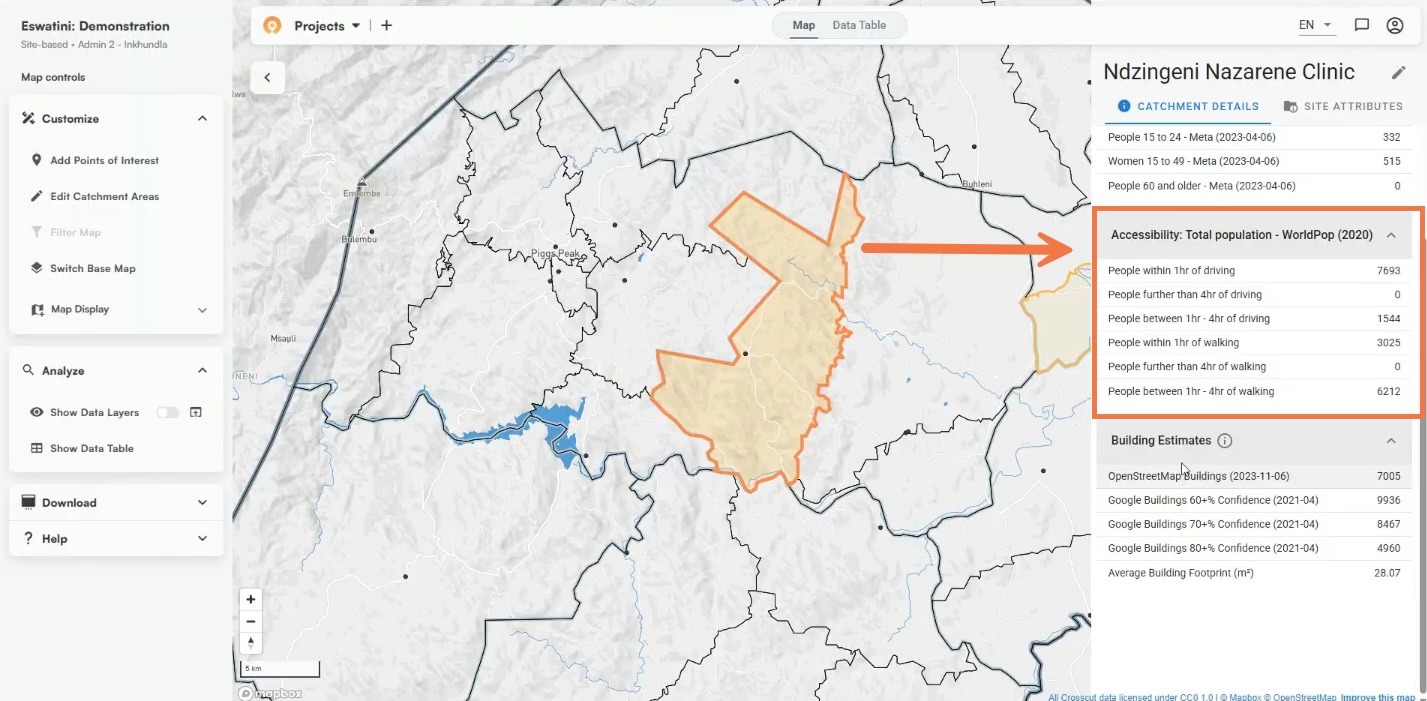
Travel time and accessibility
Smappen offers walking, driving, cycling, transit, and truck. Crosscut offers walking and driving. Neither factors in live traffic, so the 20-minute drive will look identical on the map at 2am and at peak rush hour. Actual travel time will vary, particularly in dense urban areas with more traffic.
For most coverage or territory planning that tradeoff is fine as long as you factor it in. The main difference between the two is how each tool calculates walking time.

Smappen:
- Calculates travel time by routing along mapped road networks
- Can generate boundary up to three hours from location
- Works well in five supported markets where road data is complete
- In other areas, results depend on how complete OpenStreetMap coverage is
- No building footprint data, so walking models rely entirely on road networks even in dense or informal settlements
Crosscut:
- Calculates travel time by routing along mapped roads, the same as most tools
- Visualizes travel time in a boundary up to 10 hours and adjusts to edits in real time
- Crosscut’s walking model accounts for hills, terrain, and where buildings actually sit, using Overture building data
- More accurate results where road networks are incomplete or people move off-road
- Standard routing handles driving. The custom walking model handles everywhere else.
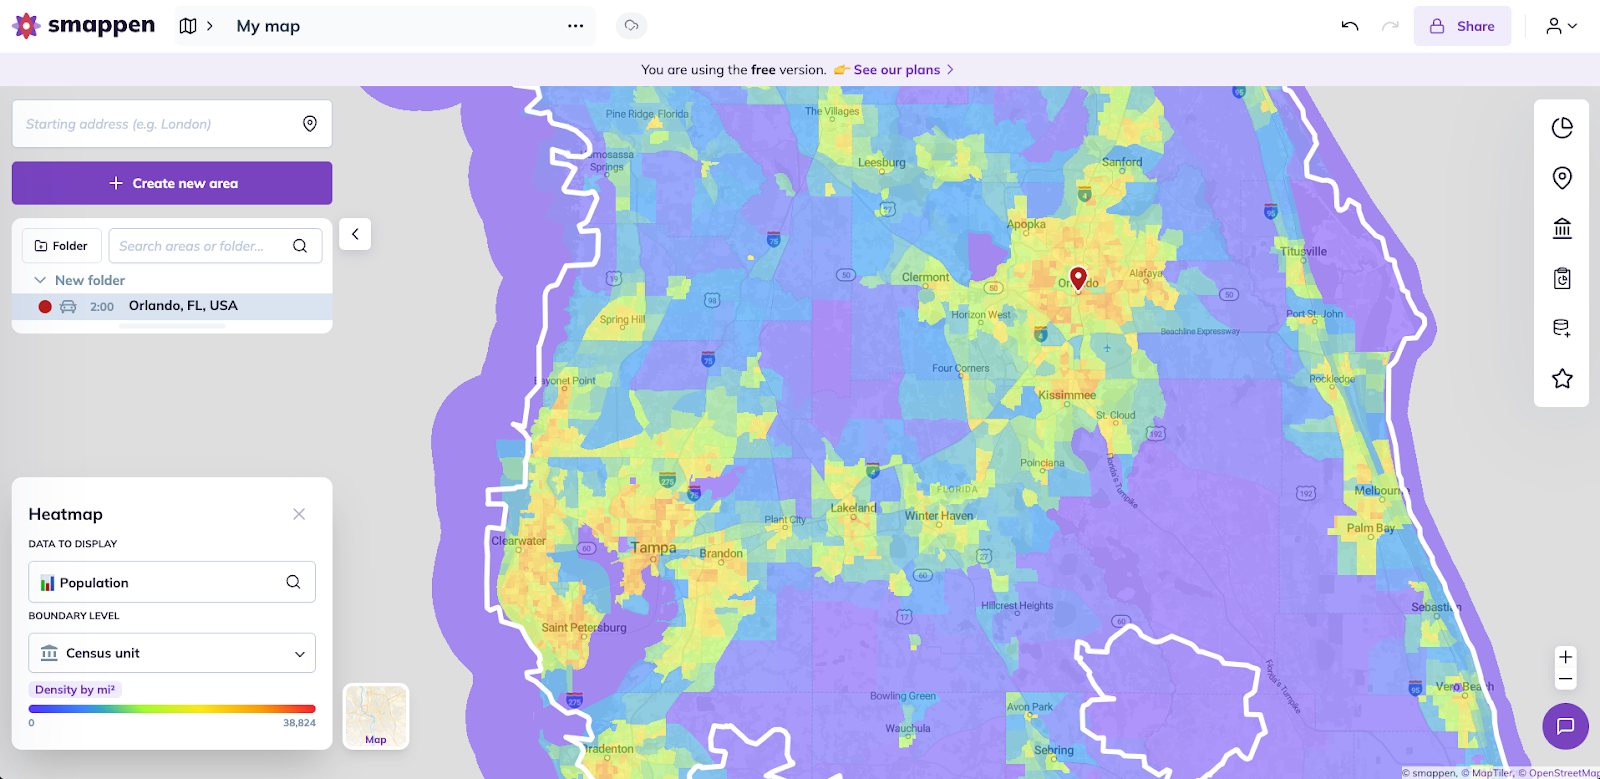
A hard-to-reach area with few people is a different problem than a hard-to-reach area with thousands. Crosscut layers population heatmap on top of travel time so the areas that need attention really stand out on your map.
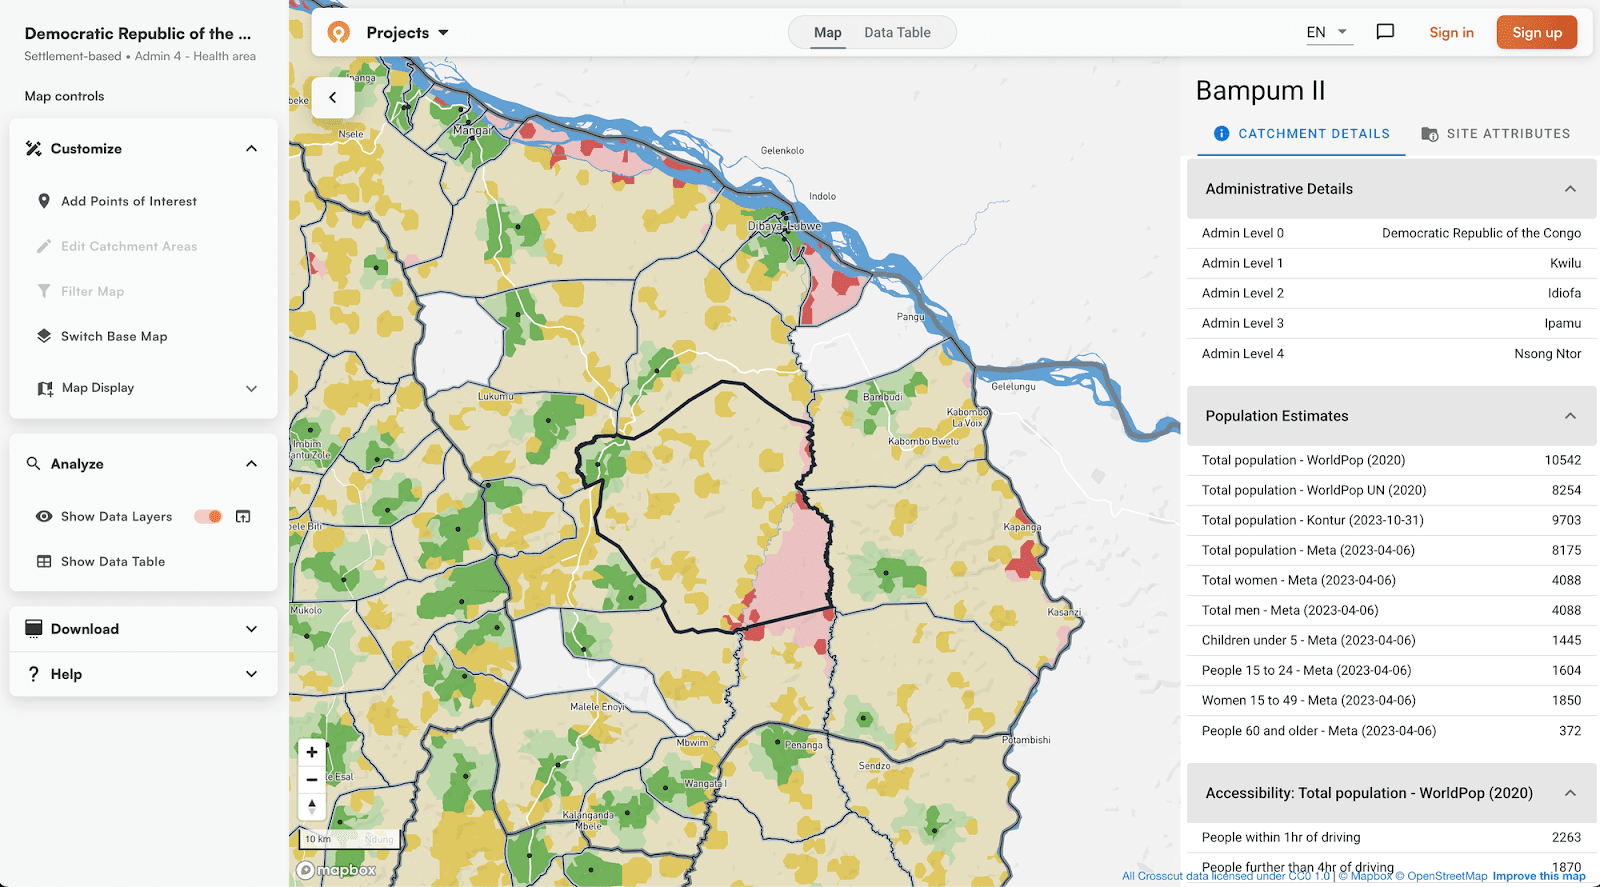
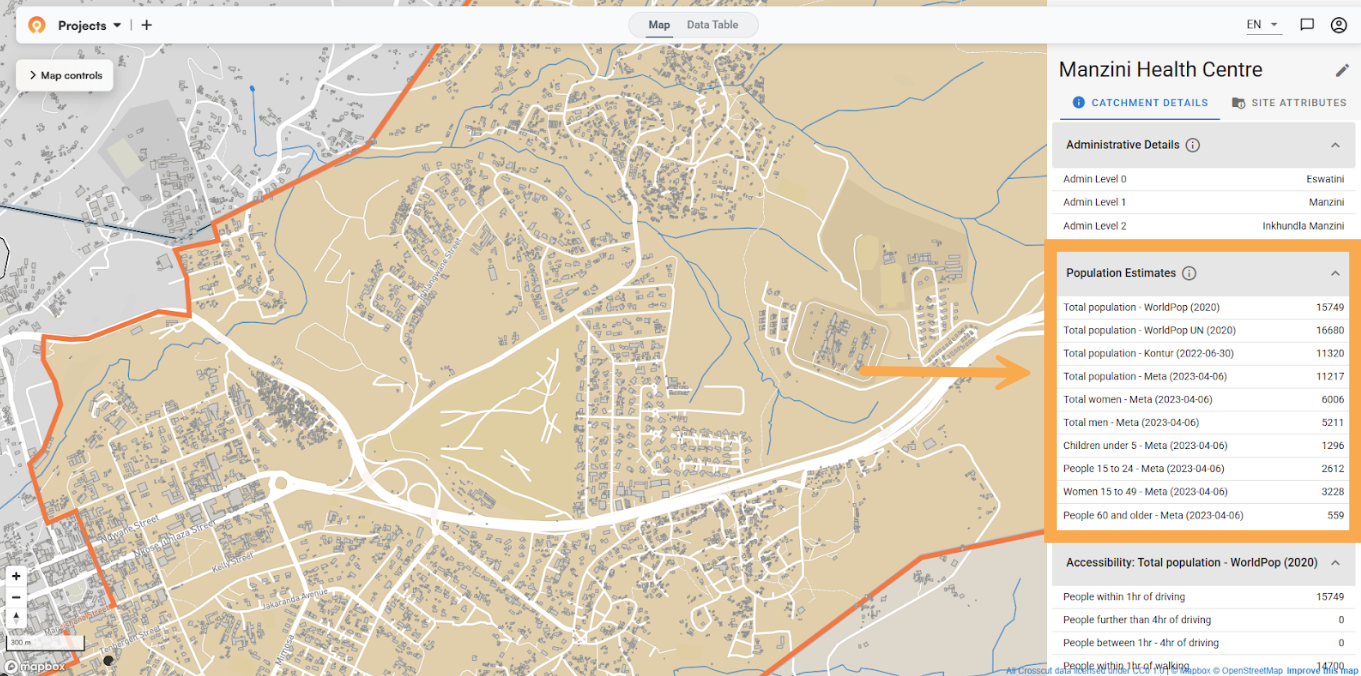
Population data & sources
Both tools make it easy to find population estimates for each catchment area. How each tool arrives at those estimates is much different.
Smappen:
- Census data, most recently updated to 2023
- Rich demographic filtering by age, income, employment, household data, ethnicity, education, commuting patterns
- Limited or no population data outside supported markets
Crosscut:
- Multiple named sources: WorldPop, GRID3, Meta, and Kontur, displayed side by side
- Sources can be compared so you understand where they agree and where they diverge
- Age and gender breakdowns free across all countries
- 2026 data uses WorldPop Global 2, the first major update since 2019
When you are planning at the district level or below with older census data, a single outdated census number without other sources to compare to is hard to act on.
Editing boundaries
Plans will often change and catchment maps often need adjusting after the first version is built.

Smappen:
- Boundaries cannot be edited after a catchment is generated
- To make any change, you delete the catchment and redraw from scratch
- For large networks this means any correction restarts the work for that location entirely
Crosscut:
- When a boundary needs adjusting, you paint it on the map
- Population counts update as you make edits
- No need to delete or rebuild, the rest of the map stays intact
Catchment maps almost always need adjusting. Whether that means a quick fix or starting from scratch determines how much time goes into keeping them current.
Points of interest
Both tools have a points of interest feature. They are built for different purposes.

Smappen:
- Searches a commercial database of businesses and locations by category or brand name, restaurants, schools, competitors, retailers
- Helps see competitive landscape inside a territory and identifying market gaps
- Available on paid plans
Crosscut:
- Lets you drop and label your own pins anywhere on the map, flagging hard-to-reach areas, data inconsistencies, or locations that need follow-up
- Pins organize by category, save automatically, and export as a CSV to use elsewhere
- Free to use
Smappen's POI search is one of the stronger features in their tool, built for understanding the competitive landscape before you commit to a territory. Crosscut's is built for after your map is made, where you spot a gap, drop a pin, and hand the coordinates to the team.
Free vs. paid services
Cost is a determining factor for many teams looking for simple catchment mapping tools. Smappen offers limited free options. All Crosscut features are free to use.
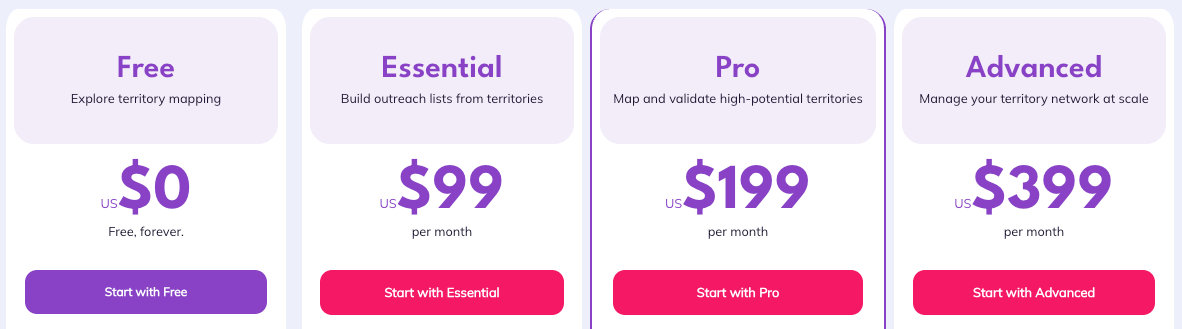
Smappen:
- Free tier capped at 10 areas per map
- Total population visible on free tier, all other demographic data including age, income, employment, and household data requires a paid plan
- Batch uploads and bulk exports require the Advanced plan at $399/month
- Teams pay for each additional user

Crosscut:
- Unlimited maps across 55 countries
- Multiple population sources and age/gender breakdowns included
- Works within Excel and email-based planning workflows
- Batch upload location coordinates and export maps and data, all free
- Custom geospatial solutions through Advisory Services
- All features always free
At a glance: Comparing catchment area mapping tools
Final verdict: Crosscut works where other tools don't
If you are planning out franchise territory or commercial site selection in the US, UK, France, Belgium, or Canada, Smappen is a strong GIS tool. The demographic depth and HubSpot integration are made for that work and it holds up well among the tools competing in that space.
The Crosscut App is a Smappen alternative built for planning teams doing coverage planning where data is incomplete, geography is difficult, and every location needs to be accounted for. It is free, easy to use, and the app is the perfect place to start for non-technical teams.
If you're not sure which applies, or your region isn't covered by either tool, reach out through Advisory Services and we can talk through what you need. Or just try the app.
Related Posts
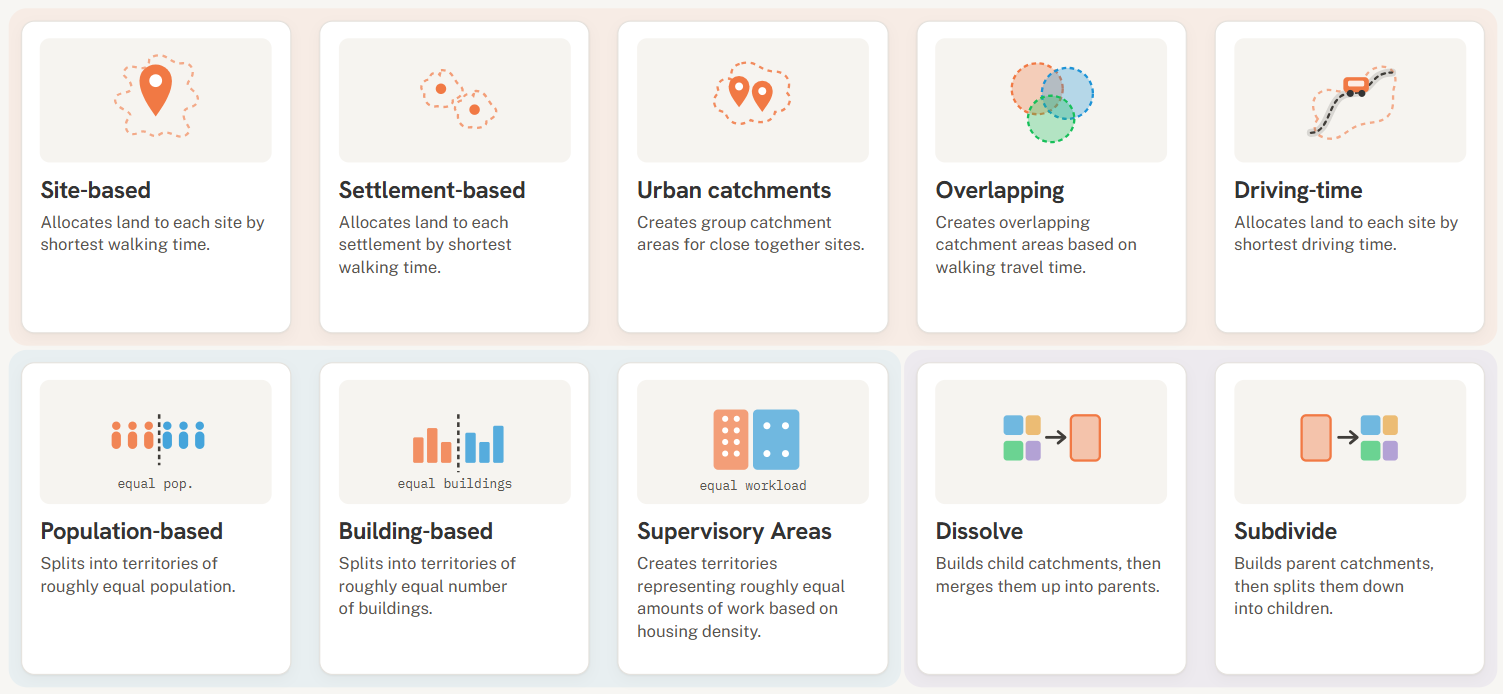
Choosing the right catchment area mapping method in the Crosscut App

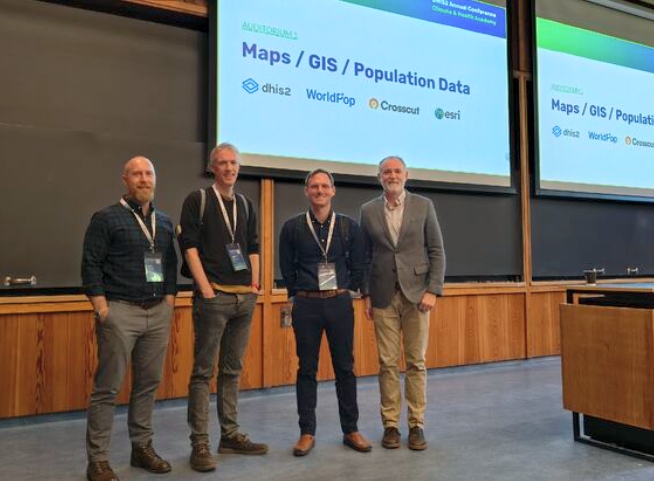
DHIS2 Annual Conference 2026
.JPG)

How to create catchment area maps in DHIS2 with the Crosscut App
