
September 2025 updates: Community-level precision and pilot momentum

We spent September supporting WHO's geospatial microplanning work through pilots with Carter Center and Sight Savers in Nigeria and Guinea-Bissau. Software development work and updates included adding community-level data editing, real-time outlier detection, and expanding coverage to new areas.
Community-level control that actually works
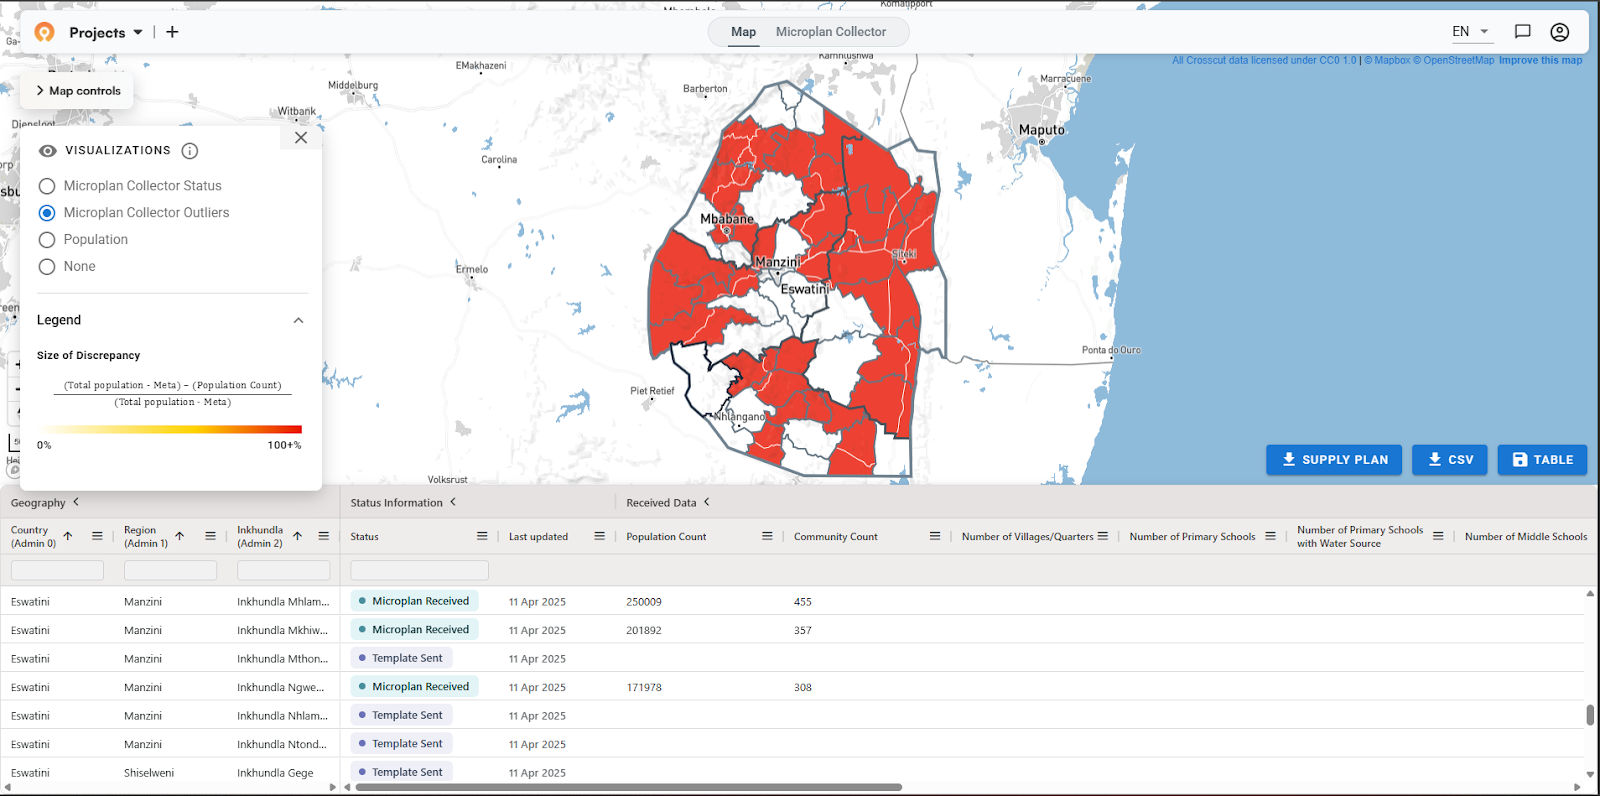
Brianna tackled one of the most requested workflow improvements this month. The new "Community Rows" feature in the Microplan Collector lets you expand any data table row to see – and edit – population data at the community level.
This change now lets health program managers change community-level estimates during the microplan review meeting. Community-level population benchmarking, analysis, and adjustment is core to the microplanning process, and the Crosscut App facilitates this review. You can drill down, make corrections, and see updated population outlier visualizations in real-time.
Community-level population data editing showing real-time outlier visualization updates as users adjust estimates in the Microplan Collector.
The updated outlier detection allows for population benchmarking at all levels from province to district to health facility catchment or lower. You can toggle between district and ward views to see which areas stand out from a benchmark data source. We currently offer Grid3, WorldPop, Meta, and Kontur as benchmark sources.
Better visuals, better team alignment
While Brianna focused on data functionality, Emmanuel worked on a visual enhancement that's been lingering on our to-do list. When you have territories within territories – like fair supervisory areas inside health zones – it was hard to see how they relate to each other on the map.
His design adds colored areas that clearly show which smaller areas belong to which larger ones. This builds directly on the two-tier catchment feature we shipped in August. Now users can not only create balanced territories, but actually see how they nest together.

Behind-the-scenes geocoding and template work
Sam spent most of September adding new geographic areas to the Crosscut App and supporting James on the pilot work. He added four new areas in Nigeria and coverage in Gabu, Guinea-Bissau.
Sam's support on the pilots included enabling them to use their own microplanning templates (similar to Senegal's custom solution) and geocoding communities across Nigeria and Burundi areas. His main focus was matching place names across different data sources – the kind of painstaking yet foundational work that turns messy real-world data into usable geographic information that field teams can actually work with moving forward.
Collaborating with industry leaders
Outside the technical updates, we collaborated with a few experts tackling industry-wide challenges in their own rights. David, a former Gates Foundation Senior Program Officer, contributed a thoughtful piece about building new models for technical assistance in a post-USAID world. His perspective on creating more sustainable, locally-driven support systems resonates with what we’ve seen in the field (and on LinkedIn) for the better part of this year.
We've also teamed up with Dr. Pancy Poon and Dr. Joe Timothy from Unlimit Health for a new article. The pair shared their experience mapping health boundaries for Schistosomiasis control in DRC. Their project showed how catchment mapping works when official boundaries don't already exist and planning teams have to build from hand-drawn maps and local knowledge.

Pancy positioned Crosscut as a "novel solution" for tackling these unmapped regions, and her feedback helped us improve the in-app experience. Both collaborations are showing us how catchment mapping fits into the bigger challenges teams are wrestling with every day.
Continuing our digital public good contributions
All this pilot work feeds into our broader mission as a digital public good. Our settlement catchments from across Africa apparently get thousands of downloads on HDX. HDX staff told us it is one of the most downloaded datasets on HDX, though we can't see who's using it.

Looking ahead to October
In October, we will continue supporting NTD programs in Nigeria and Guinea-Bissau in geospatial microplanning and we hope to share more soon.
Get in touch if you want to talk through a specific use case through our Advisory Services – or if these features solve problems you've been wrestling with.
Related Posts

Vital Supply Chain: Building a Fellowship for a New Era in Global Health

Mapping Health Boundaries Where None Existed: Schistosomiasis Control in DRC


Two-Tiered Catchments: Creating Territories Within Territories

