
March 2026 update: Building out ESPEN's Schisto Mapper tool

Most people know the Crosscut App as a free tool for generating catchment area maps and service territories for health campaigns. What many don't know is that we also built and maintain the Schisto Mapper tool. This is a separate application built on our same underlying technology to help WHO AFRO’s Expanded Special Project for Elimination of Neglected Tropical Diseases (ESPEN) target and treat schistosomiasis.
March was mostly spent on one project: finishing the integration of the Schisto Mapper with the ESPEN Portal. Now programs across sub-Saharan Africa can open the tool with their own country data already loaded in.
A quick primer on schistosomiasis
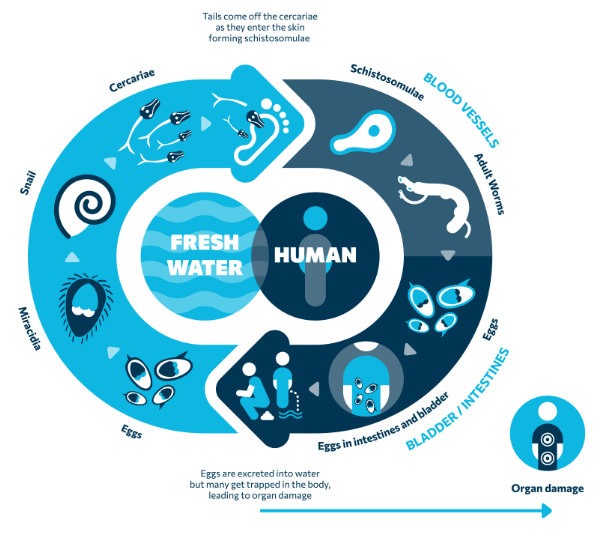
Schistosomiasis, or schisto, is a parasitic disease carried by freshwater snails. It's the most significant parasitic disease in Africa after malaria, and wreaks havoc in susceptible populations. Over 264 million people are affected globally, and it kills an estimated 200,000 people a year.
Infection happens through contact with contaminated freshwater during ordinary daily activities: fishing, bathing, washing clothes. The worms enter through the skin and without treatment can keep laying eggs inside the body for years. In children especially, the long-term effects are serious, including stunted growth, chronic illness, and lasting impacts on cognitive development.
The primary method for combatting this disease is the mass drug administration (MDA), where teams deliver treatment to affected communities using a drug called praziquantel. More than 253 million people needed treatment in 2024, yet only about 40% were reached. Closing that gap means knowing where to treat, how often, and at what scale. That's the gap the Schisto Mapper was built to fill.
Why schisto is hard to target
Schisto is highly focal, meaning it spreads unevenly. One community can have very high infection rates while one just a few kilometers away has almost none. Factors like local water sources, snail habitats, and sanitation infrastructure can all drive that variation, which requires local, community level data to actually identify and treat.
Historically, treatment decisions are made at the district level, sometimes called an implementation unit or IU. That means every community within a district gets treated the same way, whether infection rates are high or not. This strategy is manageable and has worked, but it wastes medicine where it isn't needed and often misses pockets of disease where it is.
We can better understand the situation with data that is collected at more granular levels (e.g., individual communities or health zones), where the data actually reflects what's happening on the ground. That's what helps planning teams avoid overtreating areas that don't need it and missing the ones that do.
The Schisto Mapper solves the protocol problem
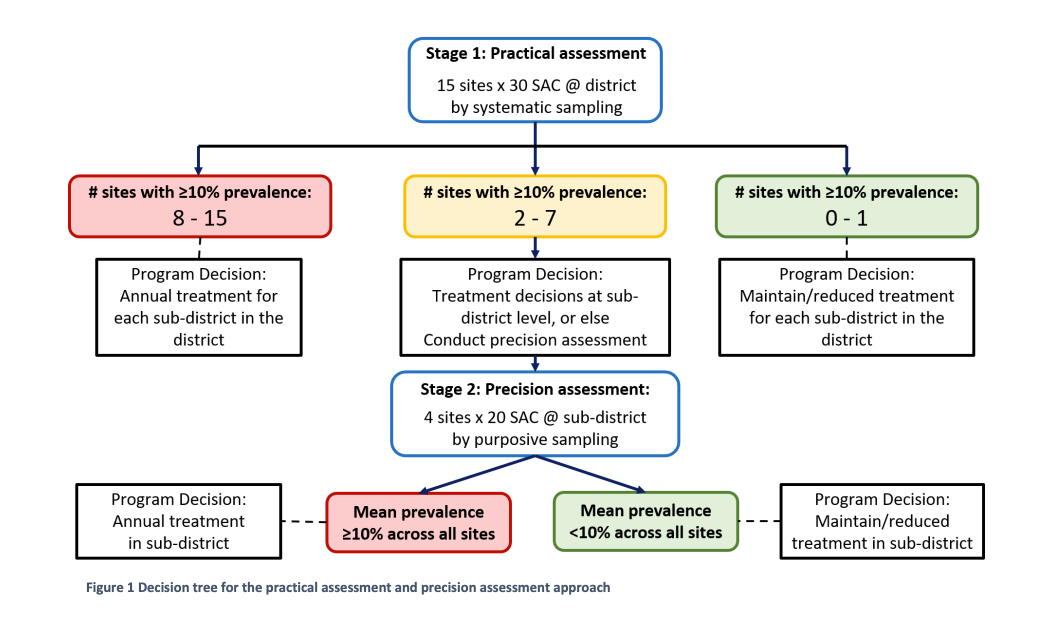
Programs that have completed at least five rounds of MDA need to decide whether to keep treating at the same intensity, scale back, or get more targeted. Making that call at a granular level requires a structured assessment process like the one provided by the Schistosomiasis Practical and Precision Assessment (SPPA) protocol.
This approach is technically solid but hard to run without a tool. It requires spreadsheets, manual lookups, and room for error across potentially hundreds of sub-IUs in a single country. We built the Schisto Mapper with COR-NTD, a coalition focused on neglected tropical disease research and tools, and ESPEN to help teams go from protocol to practice.
How the Schisto Mapper tool works
The Schisto Mapper draws on historical prevalence data and program data already in the ESPEN Portal. It applies the SPPA decision logic automatically, generates maps from survey results, and uses the SPPA algorithm to produce recommendations on type of assessment to conduct. When assessment results come in, the tool uses the SPPA protocol to suggest where MDA frequency should increase, hold steady, or scale back.
Following initial prototype testing in Kenya, Senegal was the first country to pilot the Schisto Mapper Tool. They used it to determine which areas needed more treatment, which needed less, and which showed enough internal variation to warrant more granular sub-IU decisions. But what happens if these sub-IU boundaries don’t already exist?
What we built in February and March
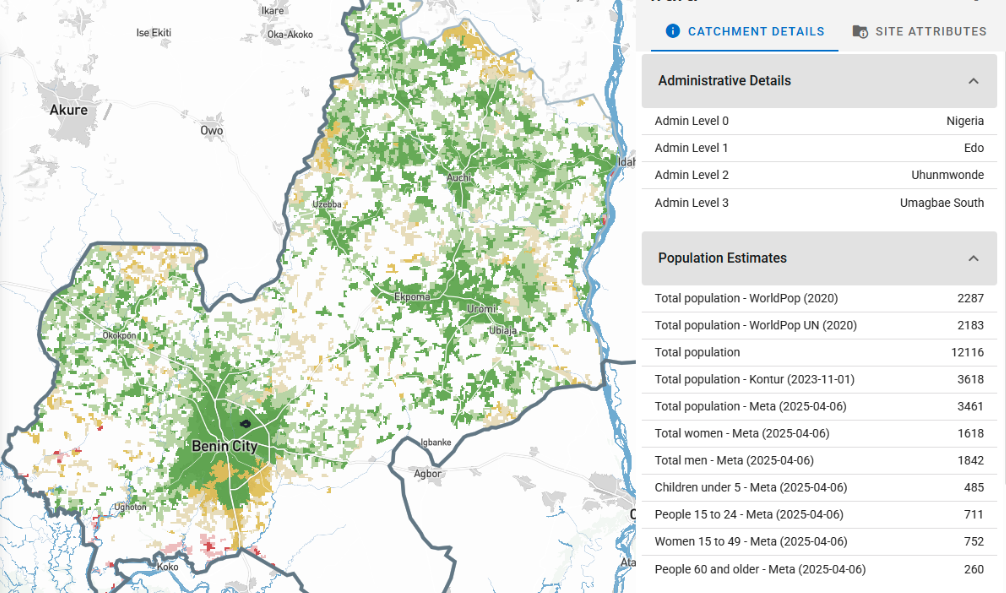
The Schisto Mapper existed before this year, but making it work at scale across the region first meant addressing a gap that's easy to overlook: only about half of schisto-endemic countries have mapped sub-IU boundaries at all.
Before the Schisto Mapper had this coverage, teams had to piece things together manually. Our partners at Unlimit Health ran into exactly this issue when planning a schisto survey in DRC. They built health catchment boundaries from scratch using GPS coordinates, village lists, and hand-drawn maps from local officials. It worked but took resources many teams don’t have.
Over the past two months we tackled that non-existent boundary issue at scale. We gathered and modeled around 88,000 sub-IU boundaries across endemic countries in sub-Saharan Africa, combining administrative records, health zone data, and modeled catchment areas where official data didn't exist. That's the foundation the tool needs to operate across the region.
We also integrated with the ESPEN Portal. The Schisto Mapper now automatically pulls in the most recent MDA round data, endemicity classifications, and other historical inputs programs need when assessing their survey approach. Before, that required manual entry or external lookups. Now it comes through directly.
The Schisto Mapper now covers around 30 endemic countries across sub-Saharan Africa, with more being added.
Focused on closing the gaps
We'll be focused on the Schisto Mapper for the next couple of months. The remaining endemic countries still need to be added, and we want to layer in map data that's directly relevant to schisto transmission: environmental suitability, proximity to water bodies, and other helpful indicators.
Making the tool easier to use is also an ongoing priority. The SPPA protocol has real complexity built in and we'd rather it live inside the tool than land on the person running it. We're also exploring an AI-assisted component that would let users navigate through AI chat rather than menus. More on that, and the Crosscut App updates in progress, next month.

The Schisto Mapper tool runs on the same infrastructure as the Crosscut App. If you're working on health campaign planning or trying to map service coverage, it's free and takes a few minutes to get started.
Related Posts

How to create catchment area maps in DHIS2 with the Crosscut App
.JPG)

How the Crosscut App helps plan health campaigns in Nigeria

An independent evaluation of the Crosscut App
