
Using settlement-based catchment territories in Crosscut
Different service planning situations call for different mapping strategies. Two of the primary options are what we call site-based and settlement-based catchment areas, and choosing between them depends on what you already know and what you need to find out.
Settlement-based catchment territories help place your facilities, service centers, or mobile teams based on where people live and gather. Whereas site-based mapping requires your exact coordinates to start planning a campaign, settlement-based mapping lets you start with existing data on community travel patterns and build outward from the highest-trafficked areas.
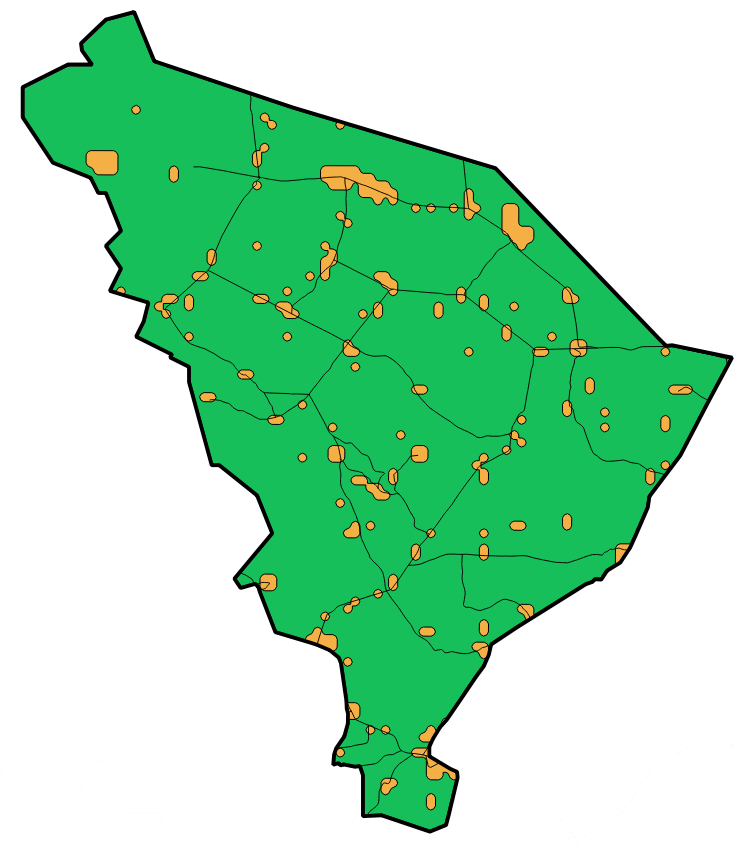
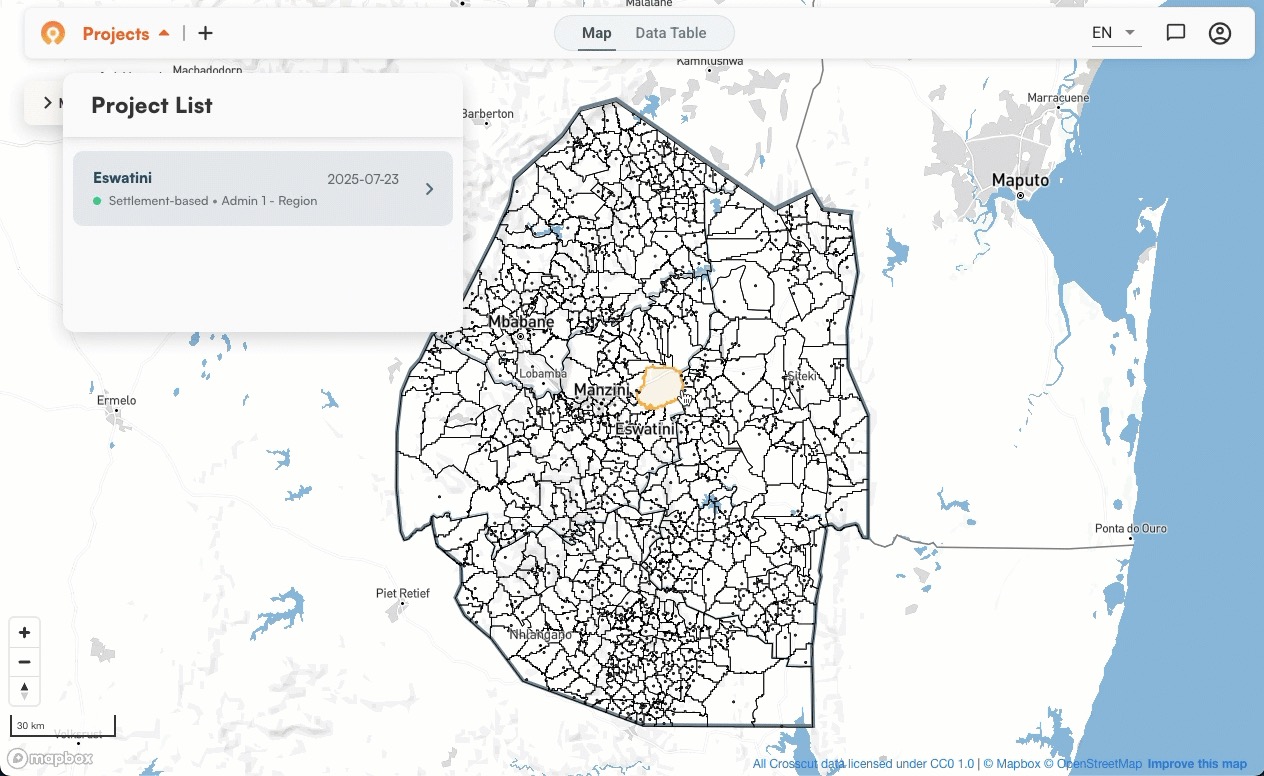
You can see the territorial boundaries and settlement centers (orange shapes) in this QGIS view, but creating these requires expensive GIS expertise and doesn't provide the population data you need for planning. See our QGIS vs Crosscut comparison for more on how the two mapping tools stack up.
The planning difficulty is that these static boundaries don't show how rural farming hamlets or rural villages actually rely on and connect to nearby towns for healthcare and markets. The right tools help you identify these connections and turn them into decisions you can act on.
When to choose settlement-based (over site-based mapping)
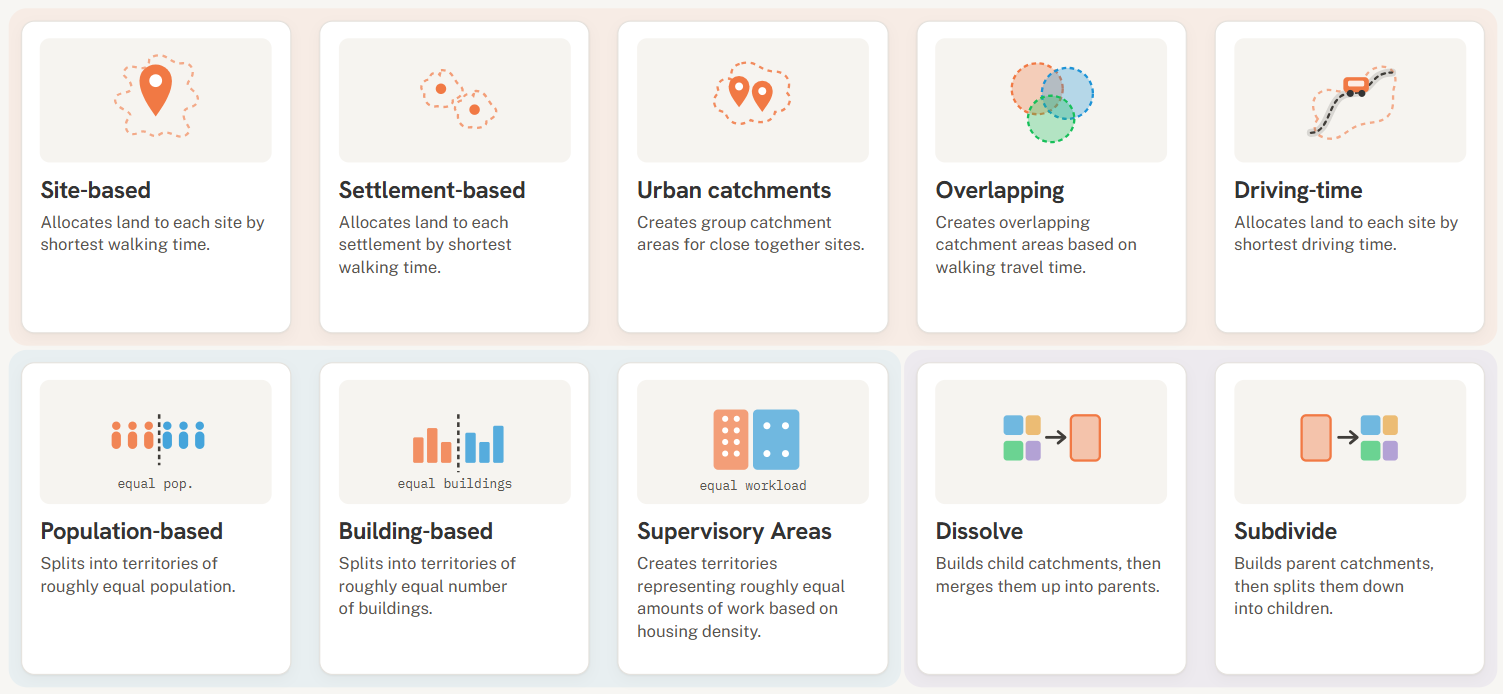
The choice between site-based and settlement-based catchment areas really just comes down to what you're trying to accomplish:
- Rural outreach planning: Site-based mapping shows coverage around your existing location. Settlement-based mapping shows you which villages naturally group together, so you can plan routes without guessing.
- New facility placement: You can see how existing settlement patterns influence where people actually go for services so you know where to locate services.
- Resource allocation without fixed facilities: Settlement-based works for vaccination campaigns, supply distribution, and mobile services by showing how communities connect and high-traffic areas to serve the most people (like a clinic or school).
- Community-centered planning: Site-based mapping starts with your facility’s location and works outward. Settlement-based mapping starts with where people actually live and move, then builds service strategies around those patterns.
Go with site-based mapping if you have a location and want to see who’s within reach. Settlement-based mapping shows you that five small villages all connect to the main town by the same road, so you know where to place your clinic or mobile vaccination sites.
How settlement-based catchments work in the Crosscut App
The good news is you don’t need expensive GIS software or consultants to create these settlement-based catchment maps. The Crosscut App is free to use and takes very little training.
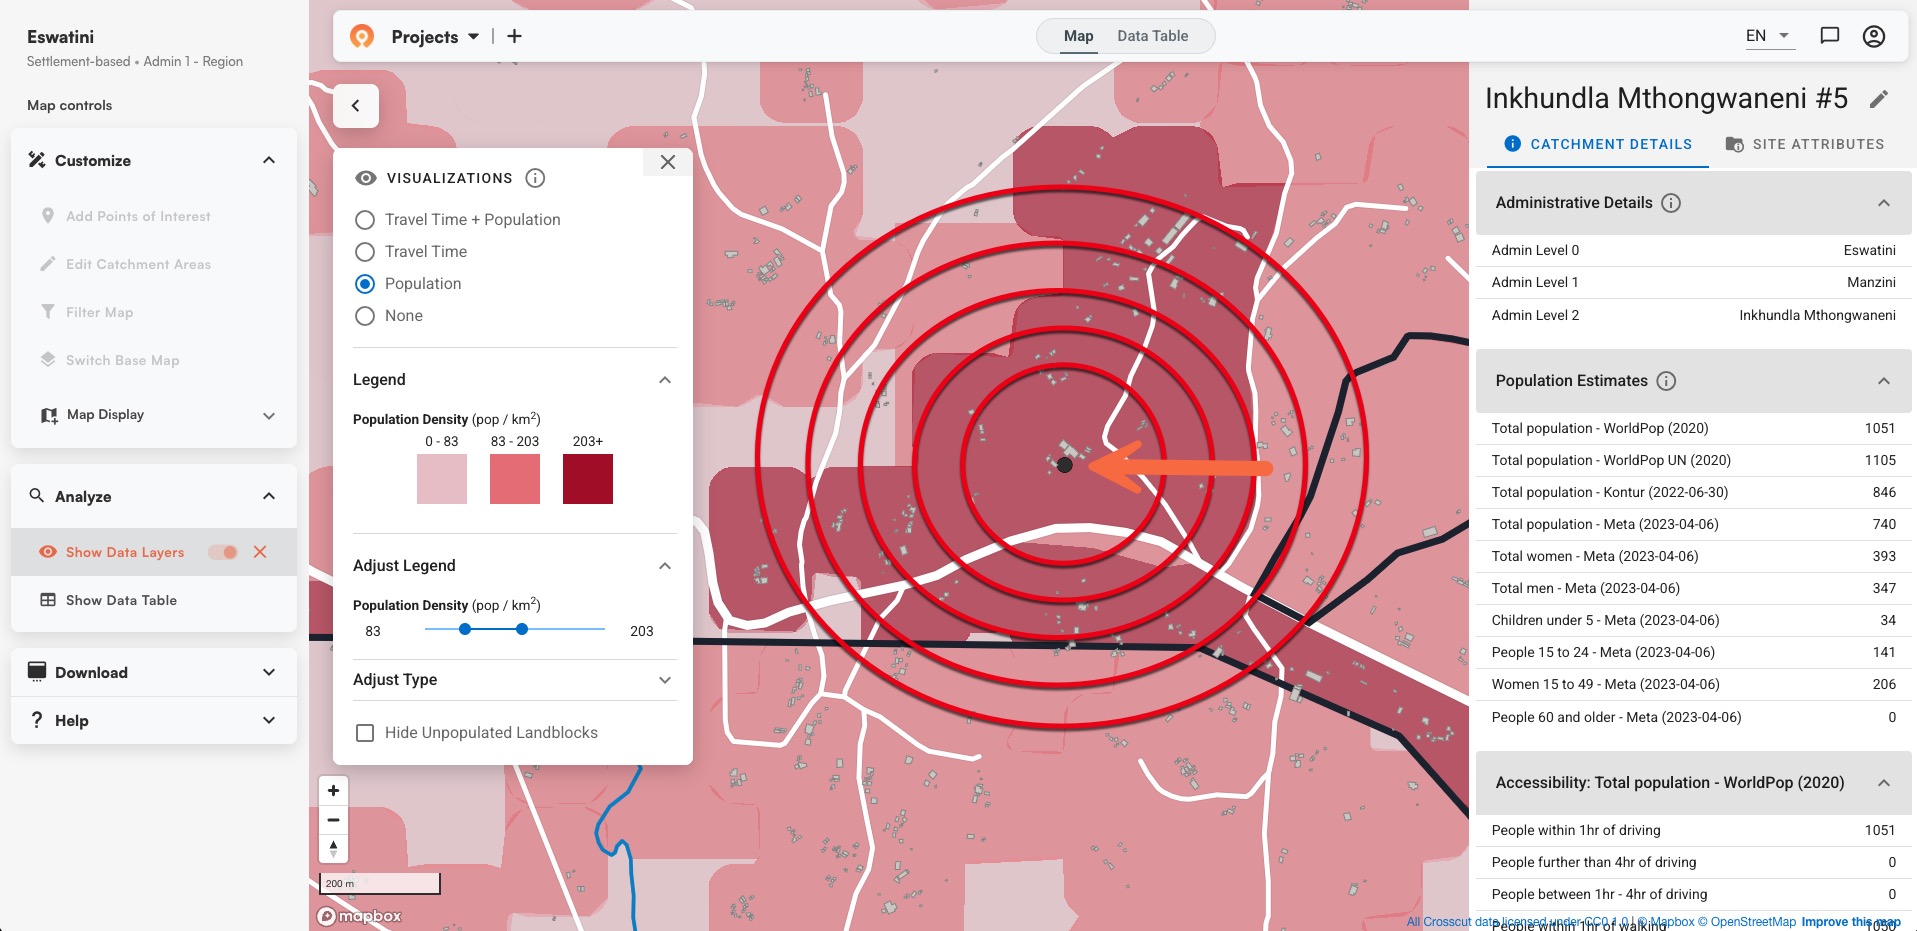
With a few simple settings, the algorithm finds settlement extents (contiguous populated areas), drops a settlement head at the population center of each cluster, then builds settlement catchments that show how those centers connect to serve surrounding areas.
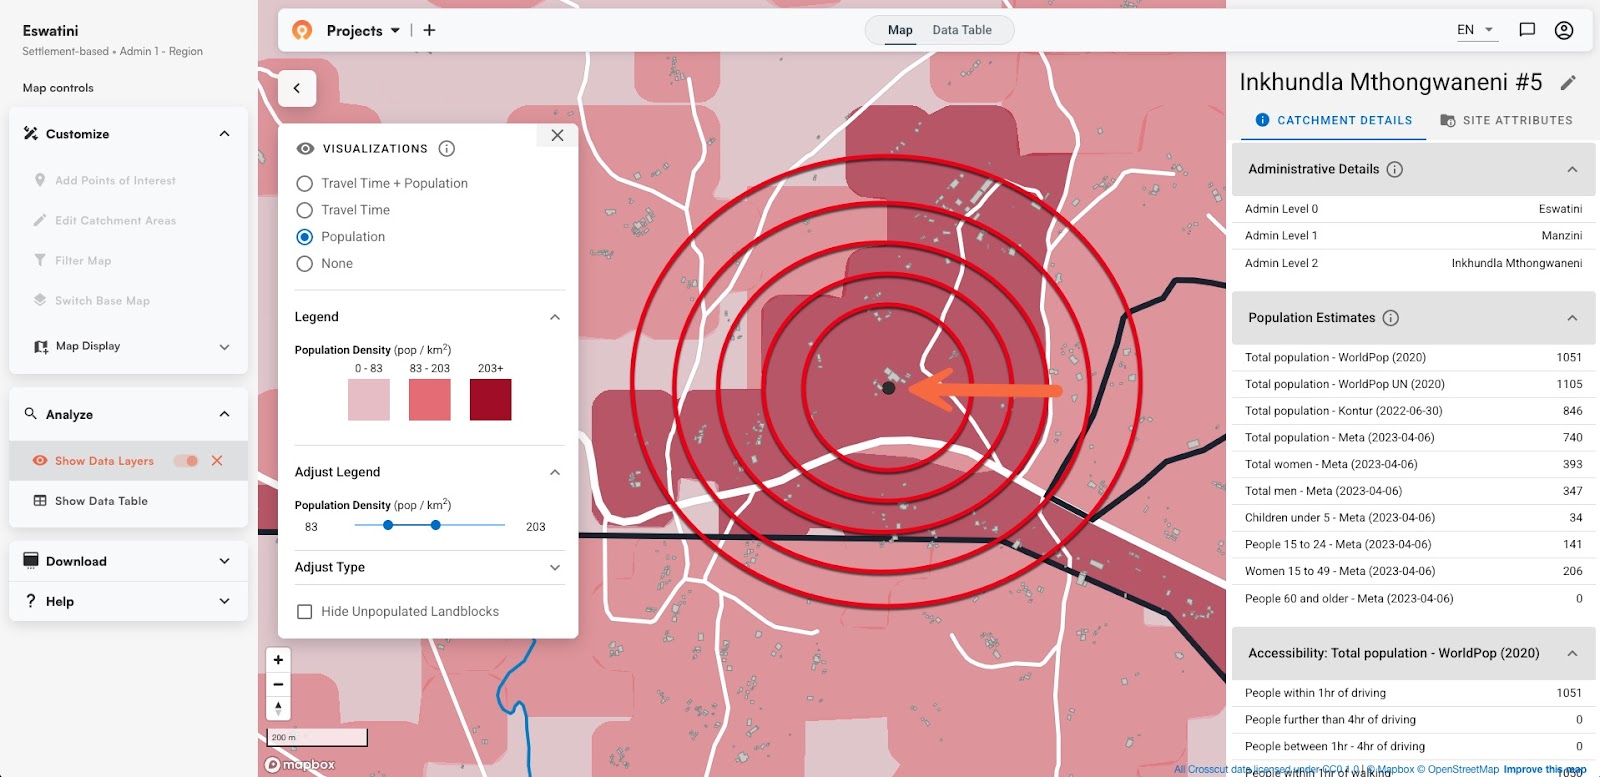
Notice how the grey blocks (representing homes, offices, and other buildings where people spend time) cluster around settlement heads. While these aren't a direct factor in the algorithm, they are a helpful visual cue that show where people in different areas tend to gather together.
All this technical work happens behind the scenes, so you're just making a few simple dropdown choices using information you likely already have available.
Three simple steps to settlement-based catchments
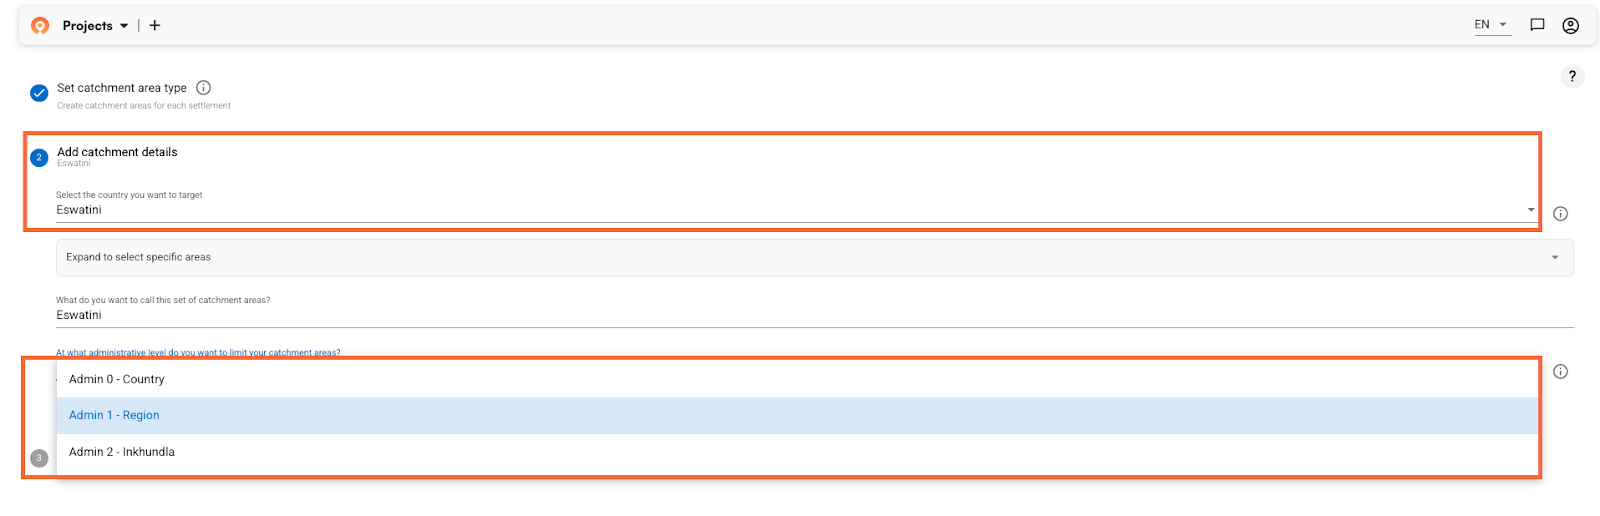
Your first decision is choosing between site-based and settlement-based mapping, then whether to limit catchment size. "No limit" means all land gets assigned to its nearest settlement, while "Limit" lets you set constraints so some remote areas might not be included in any catchment. For example, you may want to set a total travel time of two hours by foot.
Then select your country and set coverage parameters like walking time limits (if you want a "Limit") and administrative boundaries you want the algorithm to respect (country, region, or sub-district). The app generates the settlement extents that form natural communities from sources like WorldPop and Grid3 and drops settlement heads at the most populated spots.
You can control how many settlements you want per area by setting "maximum settlements per admin area." Lower numbers give you broader coverage zones, higher numbers give you detailed community-level mapping. You balance covering everyone with practical service delivery here.
From there, the algorithm builds natural boundaries using the same modeling as site-based mapping, snapping to roads, rivers, terrain, and land cover within the administrative boundaries you've set.
What you get are groups of interconnected communities. Smaller hamlets and farming villages connect to their nearest town for healthcare, markets, and services and your campaign reaches more people by following these patterns rather than fighting them.
Workflow: Built for planning teams, not GIS experts
Adding accessibility layers and easy editing
Once you have settlement boundaries, you can add other data layers to understand what you're really working with. Accessibility heat maps show you which communities are isolated versus well-connected. Red zones highlight settlements needing mobile services, green zones show areas with good connectivity - giving you clear priorities for resource deployment.
Sometimes boundaries need adjusting when you know something the algorithm doesn't. A village might actually go to a different town due to family connections, or a new road changed where people travel. These adjustments usually require complex GIS work, but our boundary editing tools are as simple as using MS Paint.
From settlement insights to service strategy
Settlement-based mapping gives you the community insights your team needs to make smarter resource decisions. Instead of guessing where services will be most effective, you can plan around the natural patterns people already use.
Once generated within the Crosscut App, the data integrates right into your existing email and Excel workflows. Beyond accessibility analysis, everything from interactive geographic analysis in Power BI to DHIS2 integrations is designed to work within your current planning process.
Ready to try settlement-based mapping? Start mapping today or let's talk about how this approach could work for your planning needs.
Related Posts
Choosing the right catchment area mapping method in the Crosscut App

DHIS2 Annual Conference 2026
.JPG)

How to create catchment area maps in DHIS2 with the Crosscut App
