
August 2025 updates: Nested territories and smarter foundations
This month we launched a few highly requested features. New additions include the ability to create catchment areas within existing catchment areas, and a complete rebuild of the base mapping layer that powers everything under the hood of the Crosscut App. Nothing flashy, but they solve real issues teams face when trying to organize complex field operations.
These improvements (as always) came from listening to how you actually work and what you need. August's changes make those layered territory problems fewer and far between.
Create catchments inside catchments
A common request we heard from all of you: "Can I create service territories within my existing service territories?" Teams consistently needed to divide larger catchment areas into smaller operational units while keeping everything accurate and aligned. That’s where the new two-tier catchment feature is going to help a lot of planning teams get more granular.
A quick refresher: catchments are just geographic service territories that show which communities are served by specific facilities or service points. Instead of just seeing dots on a map representing a clinic, you get realistic boundaries showing the areas each facility serves. But you can run into issues when those boundaries need to be split further. For example, a national program that needs districts split into service areas, or facility zones that need to be divided for local health workers.
Now you can create these territories at multiple levels:
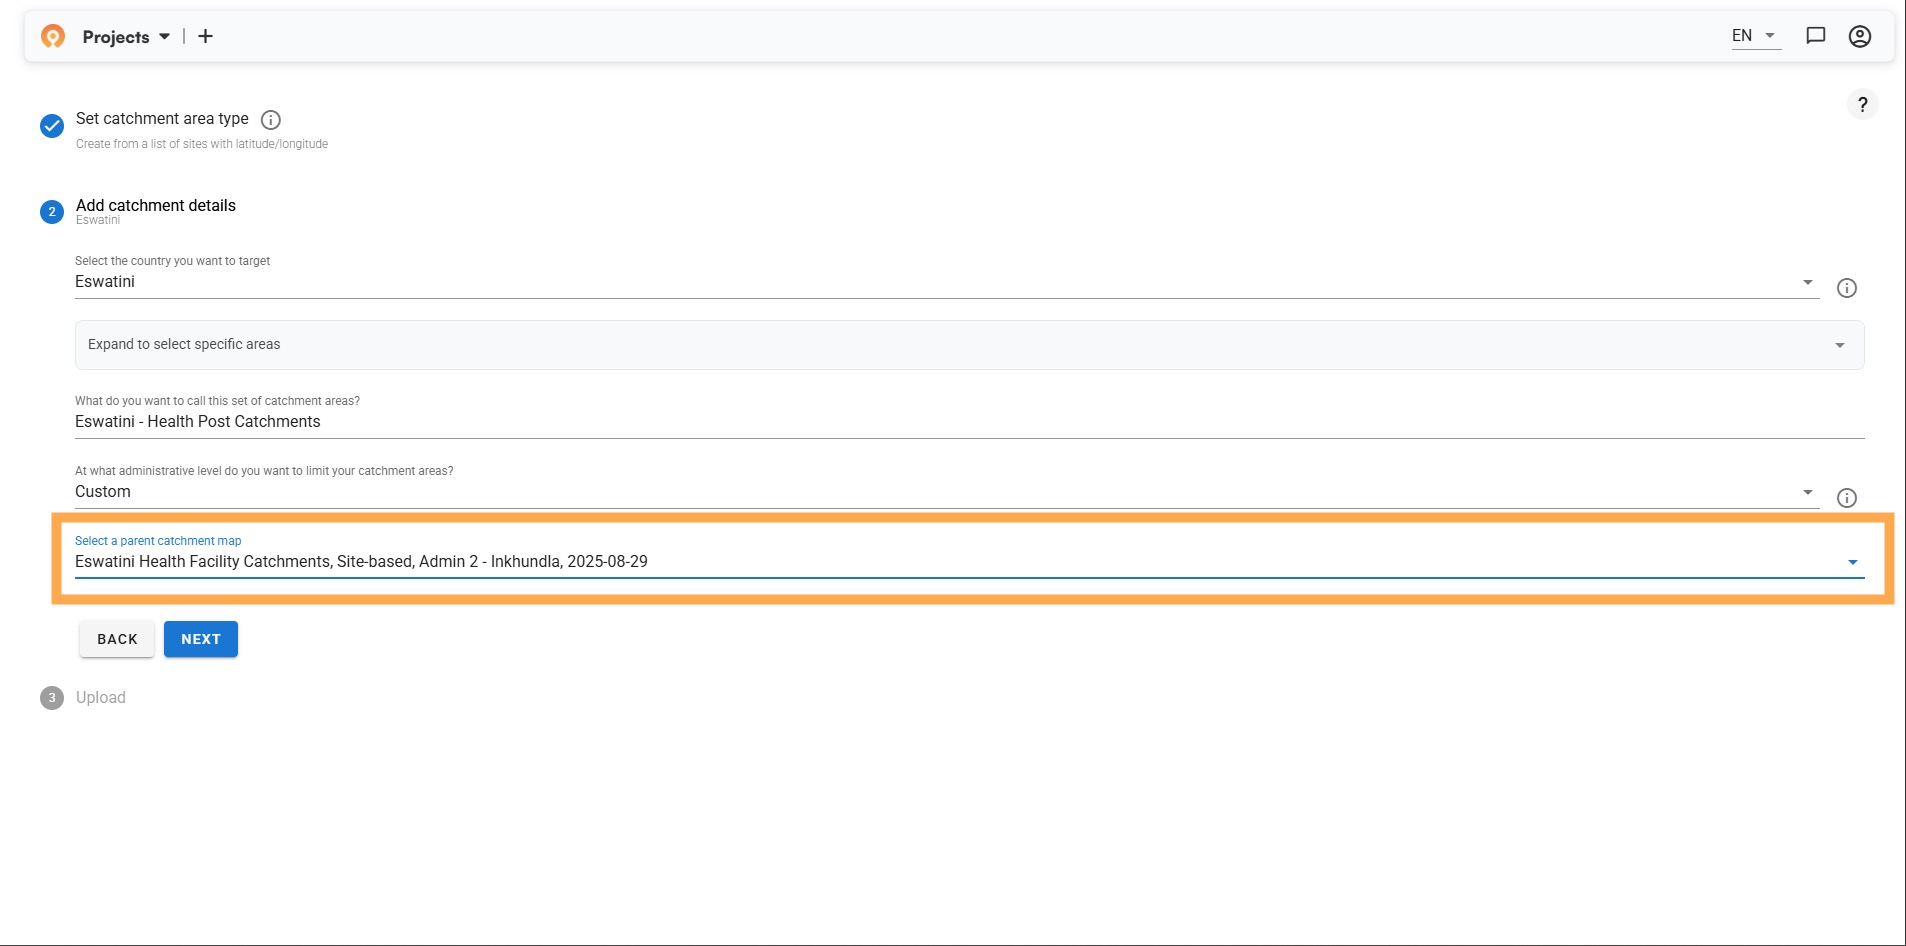
- Create your first level using any catchment algorithm, like site-based or settlement-based
- Those catchments become boundary options when you create your second level
- Your second-level territories stay within the boundaries of your first-level catchments
- You can mix and match different mapping approaches, depending on needs
The key breakthrough is that your first catchments are available as boundaries for your second set, instead of only using country or district borders. This lets you layer different mapping strategies to match your operations: settlement-based territories within site-based catchments, supervisory areas within health facility zones, or distribution teams within sales regions.
Fair supervisory areas: Balanced workloads, better results
Beyond creating territories within territories, teams needed those subdivisions to work fairly. Our new fair supervisory areas algorithm handles the territory planning and workload balancing that teams used to spend weeks doing by hand. No more sketching boundaries and calculating populations to make sure nobody gets an impossible assignment.
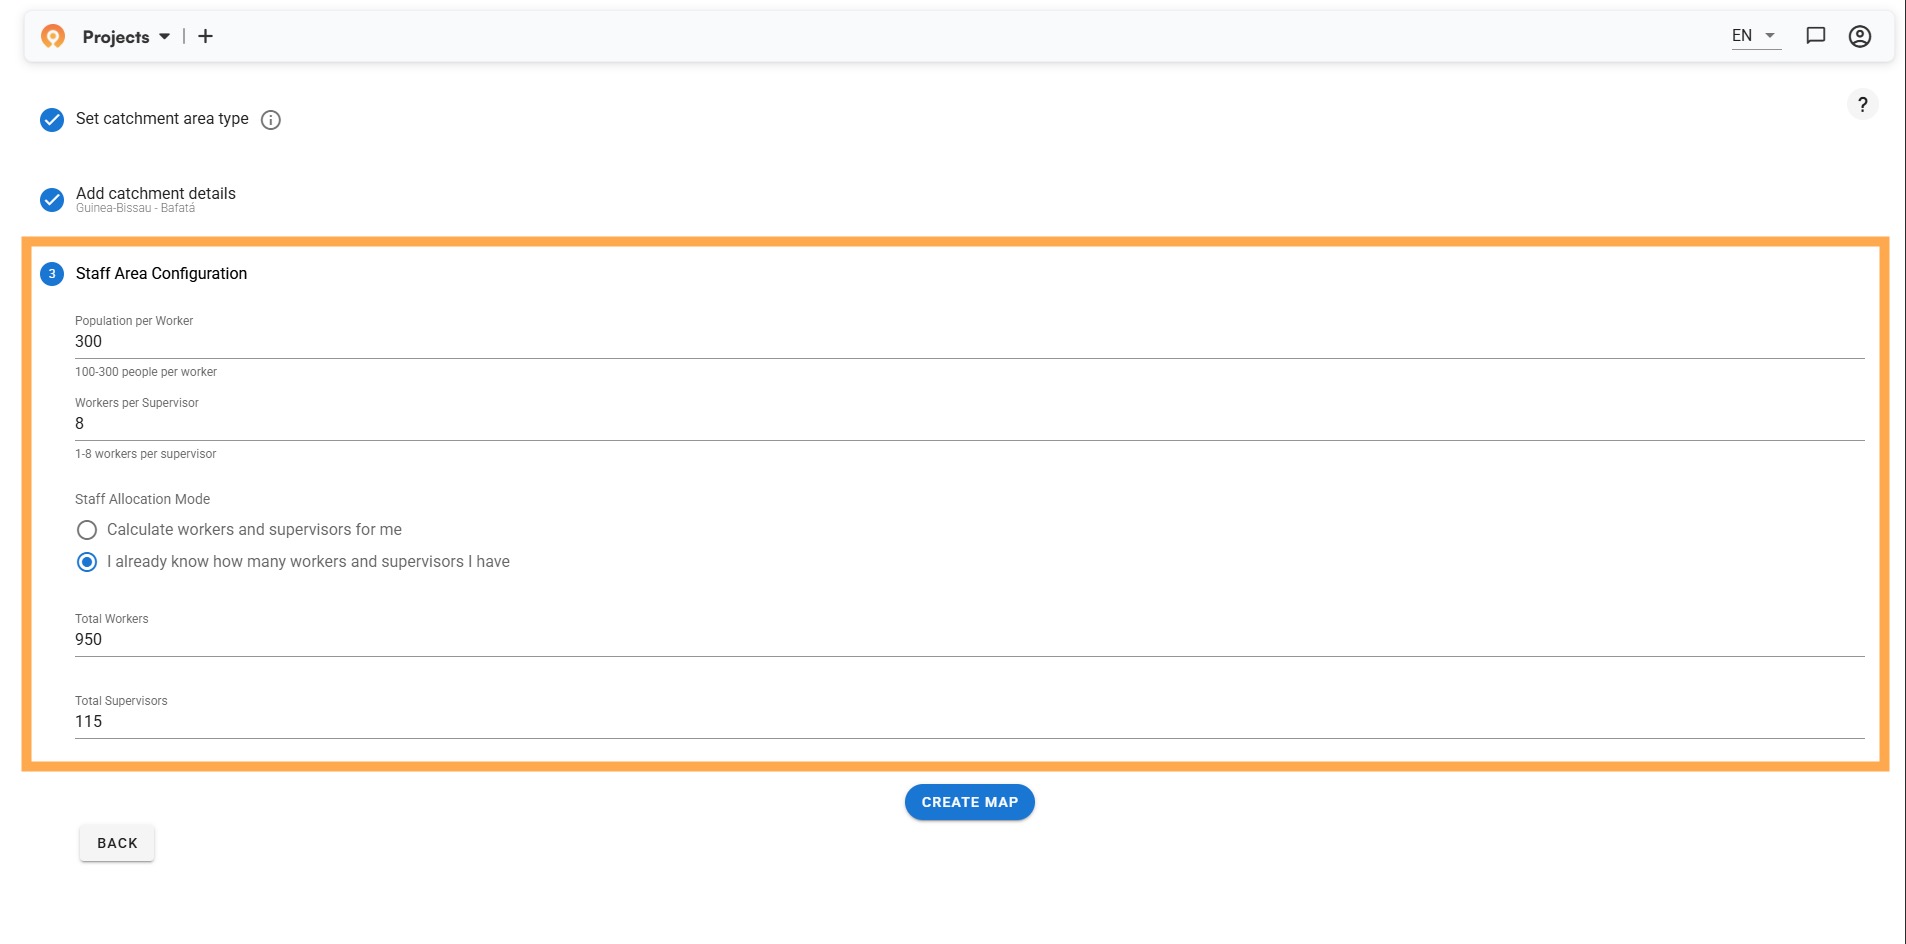
This algorithm takes any administrative unit – district, health facility catchment area, or ward – and divides it based on your operational constraints. You just need to set your target ratios: supervisors to community drug distributors (typically 1:8 for mass drug administration campaigns) and population targets per worker (usually 250-400 people per community worker). The app then handles the math and geography automatically.
These fair supervisory areas consider the reality of field work, such as population density, geographic barriers, travel time, and workload balance. The algorithm adjusts to these conditions, so rural supervisors might manage six workers instead of eight when communities are spread out and travel takes longer.
Big benefits:
- Creates balanced, contiguous supervisory areas automatically
- Respects geographic barriers like rivers, roads, and boundaries
- Works with ideal staffing or fixed budget constraints
- Replaces hand-drawn maps with digital territories teams can share and update
Whether you're organizing health campaigns or planning delivery routes, the core challenge stays the same: dividing larger areas into manageable, balanced operational units that teams can actually execute on.
Improved land blocks for faster maps
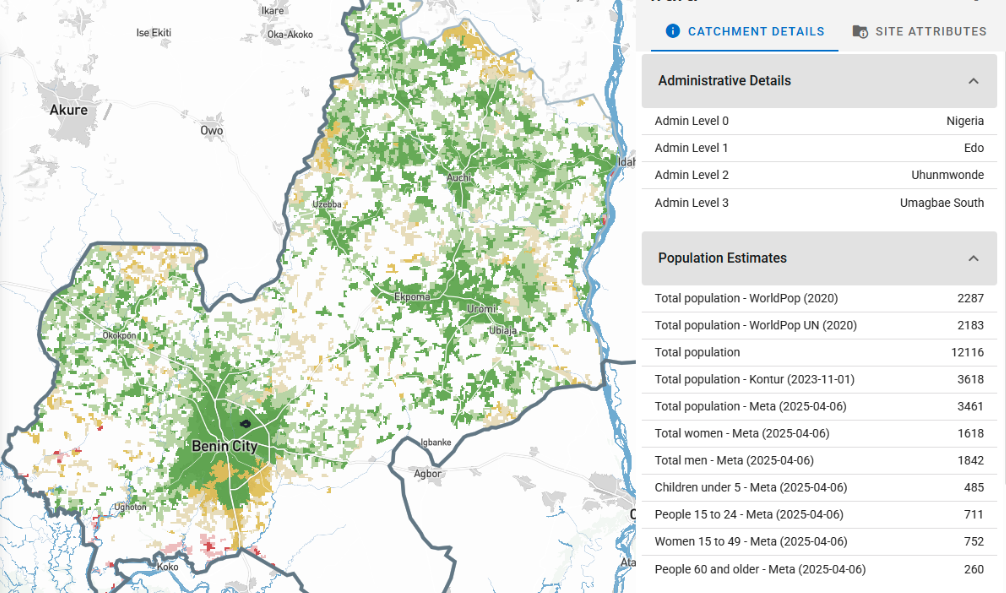
While addressing user workflows, we also completely rebuilt the foundational mapping layer that powers everything in the app. These "land blocks" are the invisible building blocks that create every catchment area – think of them as smart pixels that respect roads, rivers, and settlements instead of rigid grid squares.
The previous system traced every road and river across entire countries, creating detailed polygons even where nobody lives. This led to large file sizes, slower loading, and editing interfaces cluttered with complex shapes in empty regions.
Our solution was elegantly simple: use detailed polygons that follow streets, rivers, and boundaries in populated areas, then fill empty spaces with clean grid squares. Cities keep the street-level precision that makes catchment editing intuitive, while rural areas use lightweight squares that fade into the background.
The results speak volumes:
- Maps download 60% faster with near-instant rendering
- Editing workflows feel more responsive without jagged rural shapes
- Population visualizations better reflect where people actually live and work
- Extended performance improvements to siteless and admin-based algorithms
Live pilots across four countries
We’ve also been running pilot projects in Guinea-Bissau, Nigeria, Senegal, and Burundi for better microplanning and operational mapping. Senegal’s team asked us to adapt their Excel-based microplanning template, Guinea-Bissau needed full Portuguese language support (🇵🇹), and in Nigeria and Burundi we added new administrative boundaries to extend coverage.
Pilots like these help us track issues that don’t show up in development. They turn theory into practice by highlighting the kinds of small errors that can snowball into major slowdowns during a campaign, like template glitches or tricky boundary cases. By solving them early, we make sure the improvements teams ask for translate directly into better results in the field.
What guides us and what's next
Each enhancement traces back to specific user challenges. The two-tiered catchment feature came from health program managers organizing supervision structures within facility catchments. Fair supervisory areas address issues about unbalanced workloads. The land blocks rebuild solved performance bottlenecks so larger countries can now map much easier.
If all goes to plan, September is going to be another development sprint with some exciting outcomes for you guys. We're also working on a guest article about seeing results with real partners. For now, all these August features are live (and always free) in the Crosscut App.
Launch the Crosscut App | Explore supply chain & GIS solutions
Related Posts

How the Crosscut App helps plan health campaigns in Nigeria

An independent evaluation of the Crosscut App
.JPG)

How to set up a Microplan Collector project in the Crosscut App
