
Presenting on geospatial microplanning at ESPEN's annual meeting in Lilongwe

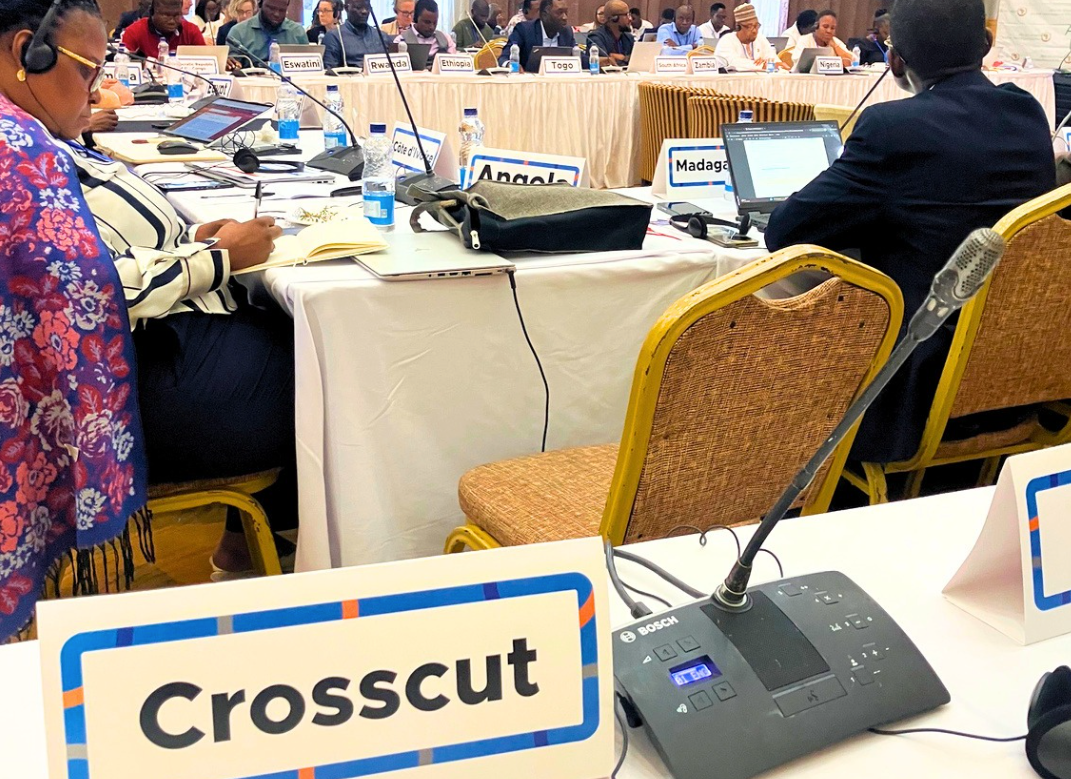
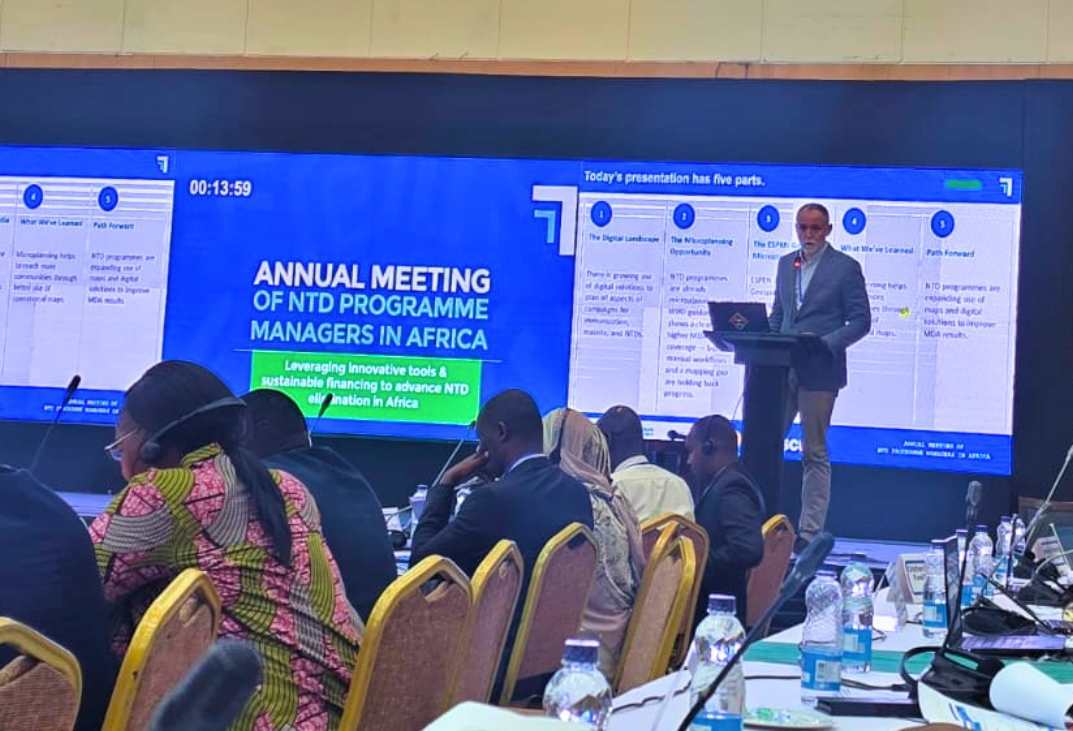
I got back from Lilongwe, Malawi earlier this week where I presented at the 7th Annual Meeting of NTD Program Managers in Africa. The event was hosted by World Health Organization AFRO Region's Expanded Special Program for Elimination of Neglected Tropical Diseases (ESPEN) and the African Union Commission.
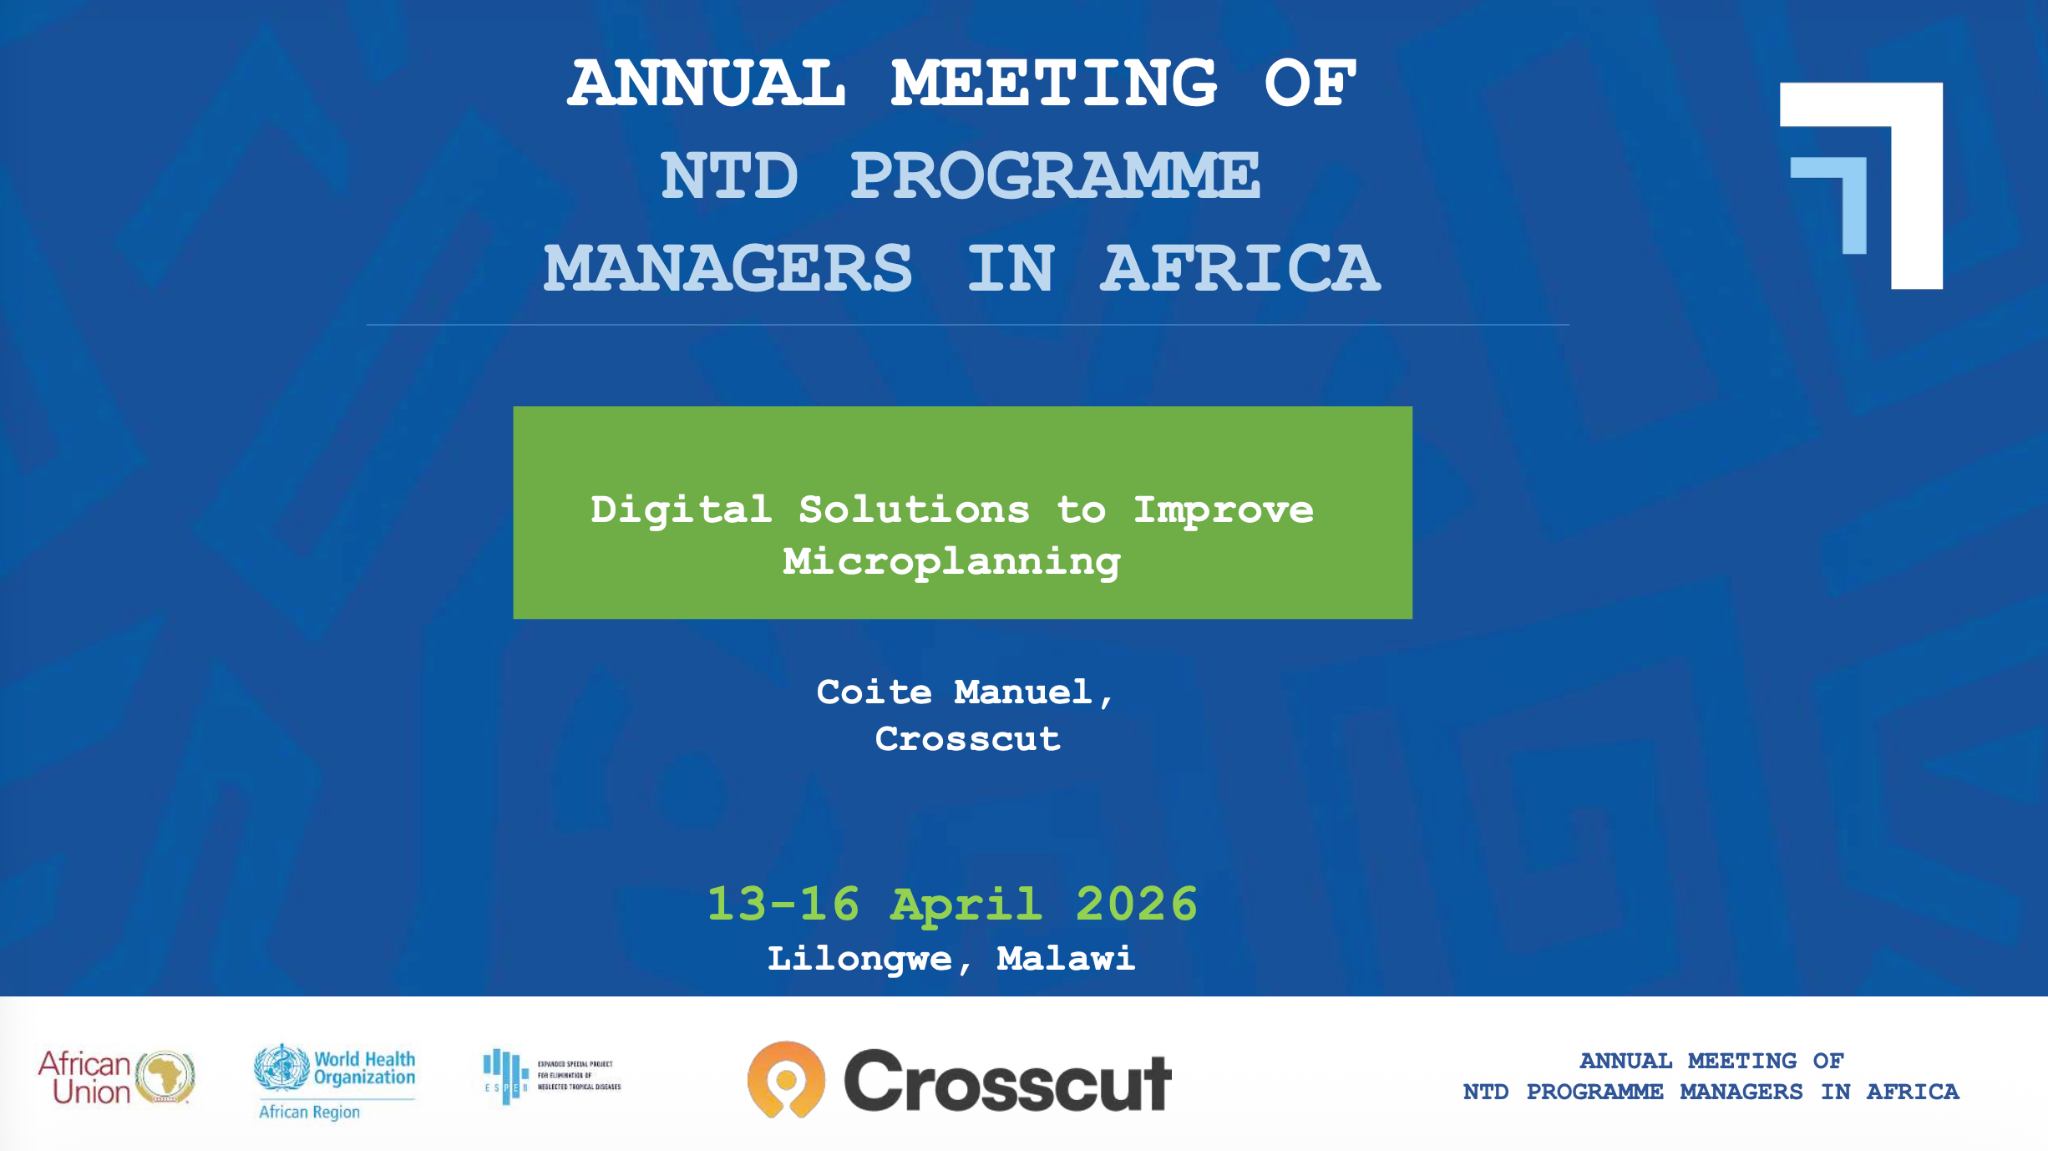
Jorge Cano at ESPEN invited me to present on digital solutions for geospatial microplanning. Jorge organized the WHO AFRO workshop last December and has played a key role in our work with ESPEN. This gathering gives program managers a chance to compare notes on what is working, share data on what is not, and move things forward together.
The theme this year was "Leveraging Innovative Tools and Sustainable Financing to Advance NTD Elimination in Africa." It featured dozens of sessions over four days translated across French, English, and Portuguese. My session on Day 2 focused on digital innovation across the region.
How NTD programs plan health campaigns across Africa
NTDs include onchocerciasis (river blindness), schistosomiasis, trachoma, helminthiases, and lymphatic filariasis. They cause serious, often permanent harm when left untreated. They are also preventable when the right interventions reach the right communities consistently enough to interrupt transmission. These meetings are one of the best opportunities we have to learn about what programs need to get there, and to share how we can help.
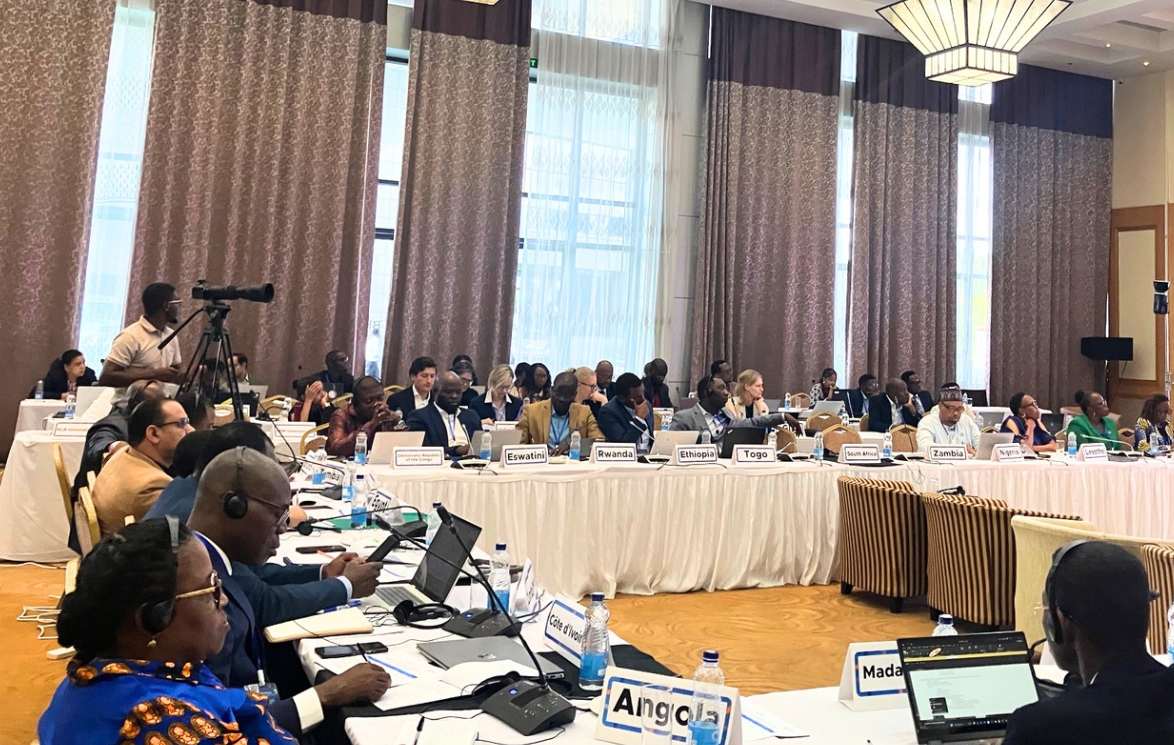
The people in that room are managing mass drug administration (MDA) campaigns across entire countries, and mobilizing tens of thousands of community health workers each year to deliver medicine and treatment. Getting it right comes down to some fairly basic but consistently hard questions:
- Which communities need to be reached, and where are they?
- How many people live there, and how long does it take to get to them?
- How do you deploy supervisors across that area so everyone shares fair workloads?
- How do you verify that distribution happened in the previous MDA?
These problems are tricky enough even when working in just one district. Across dozens of neighboring countries with tight budgets, limited GIS expertise, and population data that is often years out of date, programs risk missing communities or misallocating resources they don’t have to spare.
Nearly half of programs skip the planning step that would most improve their results
My session drew on research we conducted last year with NTD stakeholders from 27 countries in the WHO Africa region. The findings were striking but likely not all that surprising to anyone in this specific audience.
We found that 82% of programs reported doing microplanning. But nearly half rarely or never prepare operational catchment area maps. That is the one step WHO guidance identifies as most directly tied to campaign reach, and it is the one step most programs skip. The planning is happening. The maps are not happening as often, and that leads to more coverage gaps.
Without a map, planning is more fragmented and hard to pick up the next year. Teams estimate who to send where based on last year's numbers, supervisors head into the field working from habit and familiarity, and hard-to-reach communities stay hard to reach. The map layer is what connects field reality to the planning process, and it is the piece many programs are missing.
Some programs are already working with digital tools that cover the rest of the planning pipeline. They use CommCare and ODK to capture field data during campaigns. DHIS2 aggregates reporting at the national level. But none of that tells you where your target areas really are, how many people live in them, or which communities are hardest to reach.
Where geospatial microplanning fits in the digital ecosystem
The ESPEN Geospatial Microplanner, built on the Crosscut App and available through ESPEN's portal, was built to fill that gap. The tool generates operational maps that are easy to edit without requiring GIS expertise or new tools beyond what most teams already use. The app uses:
- Population data from WorldPop and GRID3
- Road networks from OpenStreetMap
- Settlement data published through HDX
- GPS coordinates from your own facility locations
Teams can connect directly into DHIS2 for national reporting and into CommCare and ODK for real-time supervision tracking during active campaigns. They can still collect and share microplans through Excel and email the way they always have. The tools sit inside the workflows programs already use rather than alongside them.
What the 2025 pilots showed in Nigeria, Guinea-Bissau, and Liberia
The country work we did in 2025 was the most concrete part of the presentation. With support from the Gates Foundation and WHO ESPEN, we ran pilots alongside Sightsavers and The Carter Center across three countries. Each started with a different planning problem:
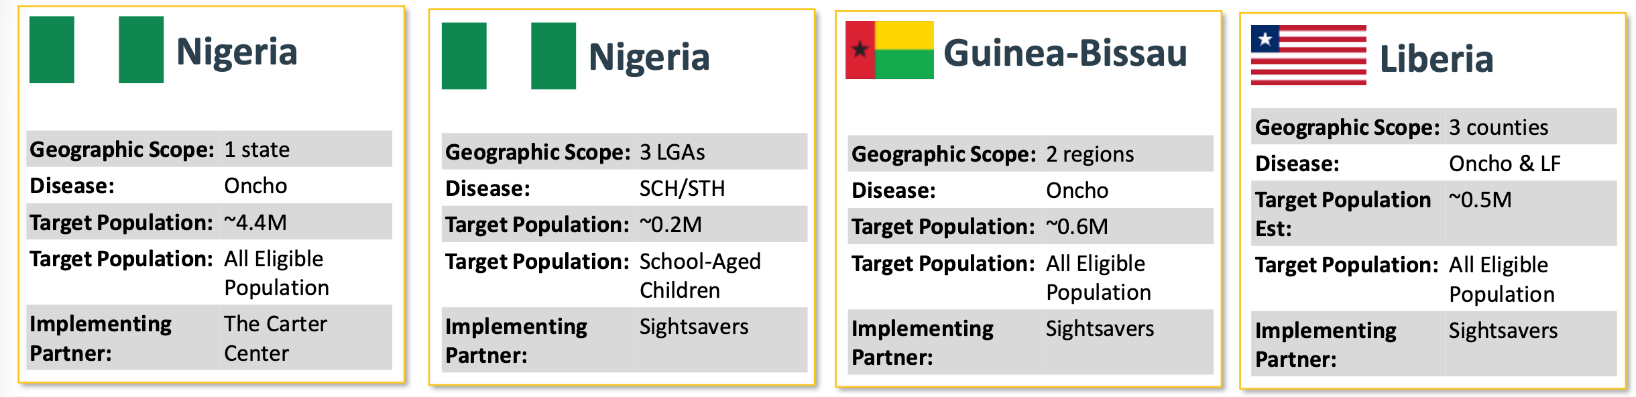
- We ran two separate country projects in Nigeria, onchocerciasis with The Carter Center and schistosomiasis with Sightsavers. Both focused on supervision gap analysis, a first-time application of the tool that used accessibility heat maps to show teams exactly which communities supervisors may never have reached in the prior campaign.
- Guinea-Bissau had a different problem. Facility catchments there covered between 10 and 30 supervisors each, which was too large to manage without clearer boundaries. We divided them into balanced supervisory territories before the campaign started so teams had workable zones rather than overlapping areas of responsibility.
- Liberia had something we rarely see. Nearly 95% of communities already had GPS coordinates linked to their assigned health facility. That meant instead of drawing catchment boundaries based on facility locations and approximating which communities fell inside them, we could build the boundaries around the communities themselves.
The results have been encouraging. Between Nigeria, Guinea-Bissau, and Liberia, 61,930 more people received treatment than the year before. Reported MDA coverage went up around 7%. And 463 settlements that had never seen a supervision visit did this year. In Grand Cape Mount County, Liberia alone, supervision coverage went from 31% to 82% of the population living within an hour's walk of a supervision visit.
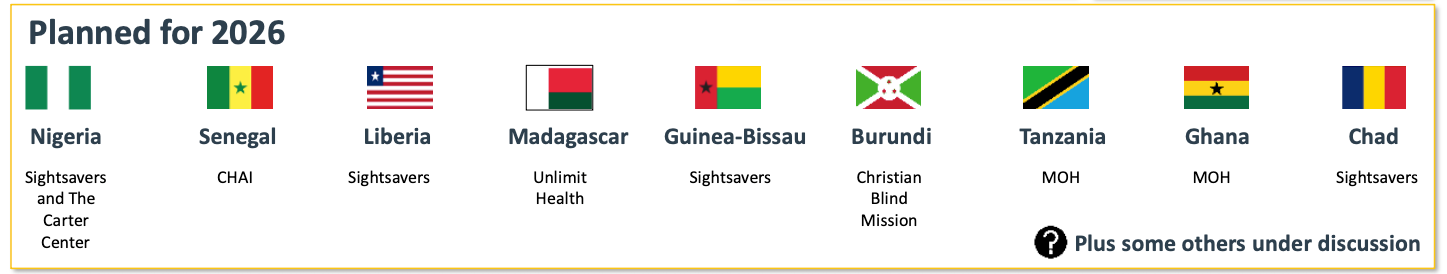
Planned projects through 2026
We're looking at nine country projects through 2026. The list includes Nigeria, Senegal, Liberia, Madagascar, Guinea-Bissau, Burundi, Tanzania, Ghana, and Chad, with others still under discussion. Most are running through implementing partners including Sightsavers, The Carter Center, CHAI, Unlimit Health, and Christian Blind Mission. These organizations help coordinate NTD campaign delivery on the ground alongside MOH in most countries.
Earlier this year we refreshed all 48 Sub-Saharan African countries in the Crosscut App to prepare for this next push. All teams now have access to WorldPop 2026 population estimates, building footprints from Overture and OpenStreetMap, and settlement data from GRID3 and other sources.
Teams can use the ESPEN Geospatial Microplanner, the Crosscut App, and the Schisto Mapper, a separate tool for schistosomiasis survey planning, anywhere in the region.
Questions after the sessions and the road to 2030
A single campaign is one data point. The real test is whether the tools hold up as part of how a program operates year to year, feeding into the systems teams already depend on. That integration work is where most of our energy is going heading into 2026.
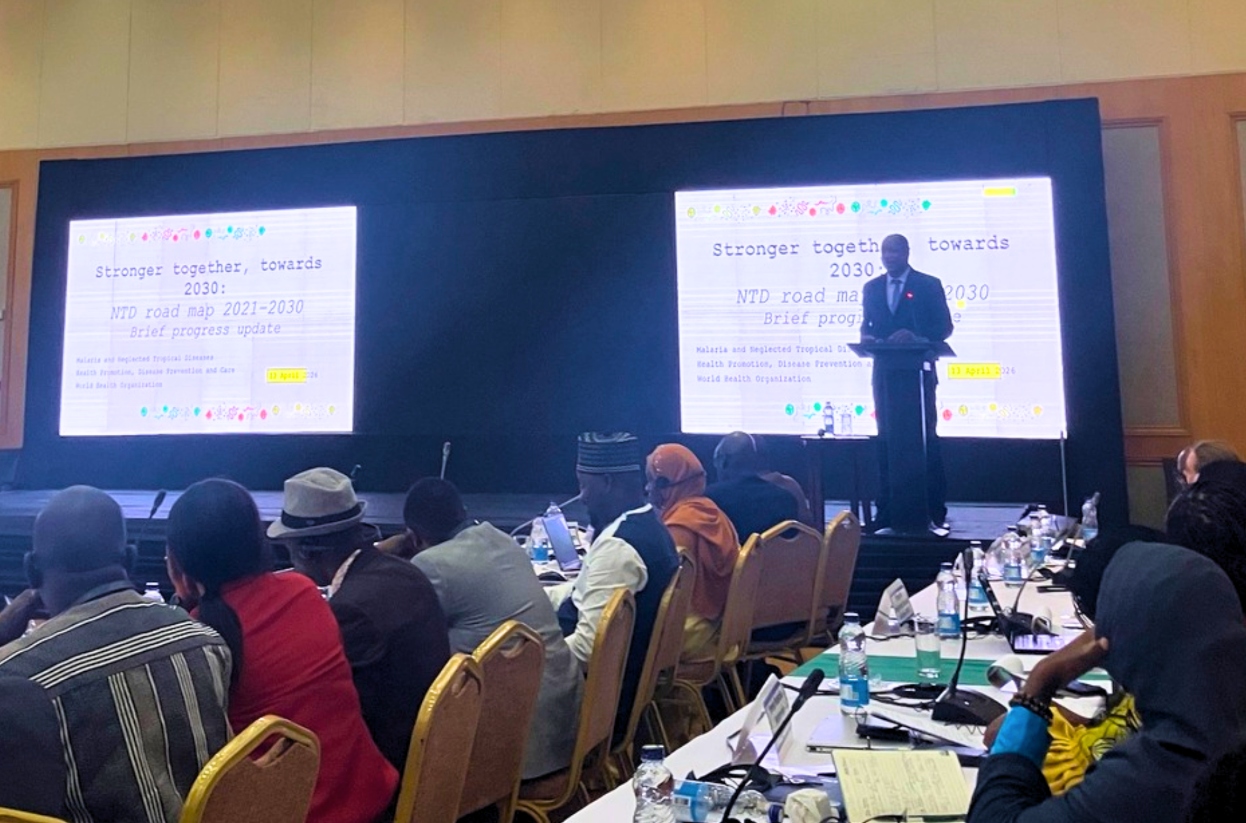
Everyone in that room is working toward the WHO NTD elimination goals by 2030, knowing that some diseases and some geographies will get there sooner than others. These annual meetings are where the community takes stock of progress, and for us they are one of the best opportunities we have to connect with programs and understand what they need.
If your program is working on NTD campaigns or health campaign planning, the Crosscut App is free to use. You can also reach me directly on LinkedIn or through our contact page.
Related Posts
DHIS2 Annual Conference 2026
.JPG)

How to create catchment area maps in DHIS2 with the Crosscut App

How the Crosscut App helps plan health campaigns in Nigeria

