How the Crosscut App helps plan health campaigns in Nigeria

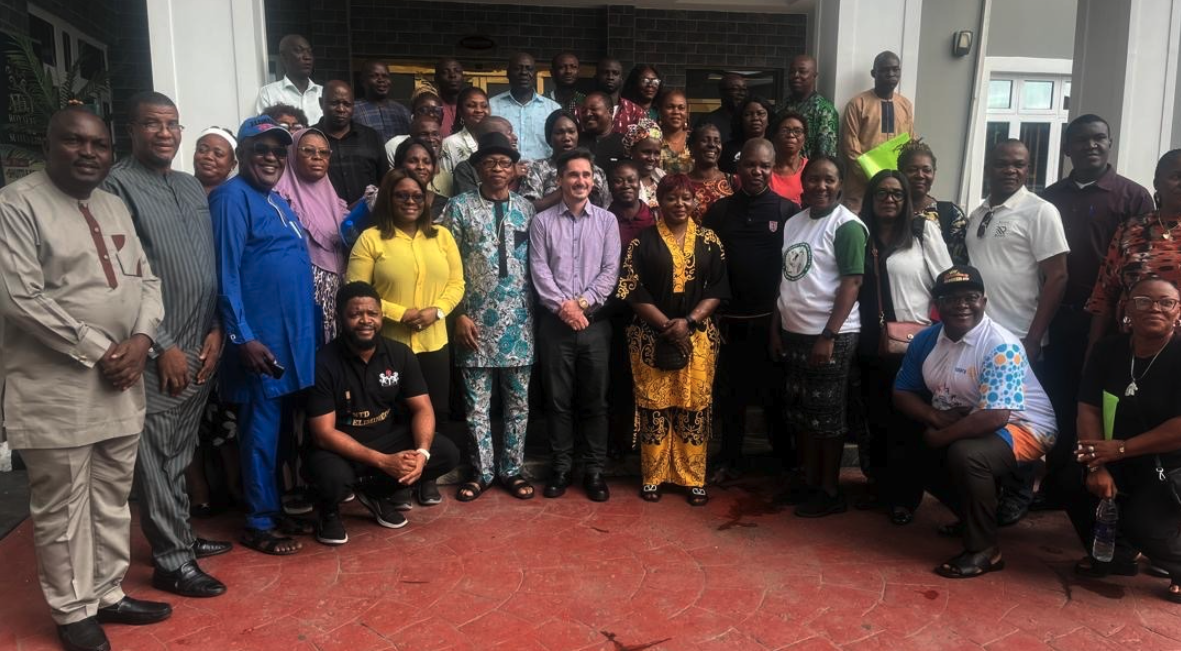
A lot of our work has been in Nigeria over the past year. I was there running trainings in person, we supported teams remotely from our desks, and we sat in planning meetings with Ministry of Health staff while campaigns were being built. What started as a single pilot has grown into engagements across four states, with different partners and different diseases.
The work in each state looks slightly different, but it comes back to being able to reach the right people. Health campaigns are supposed to reach every community in its target area. Some are almost always left out, whether missed off the planning list, stranded too far from a supervisor to verify, or cut off from the nearest training site.
This article walks through where we work in Nigeria, who we work with, and how the Crosscut App helps teams find those communities and close the gaps.
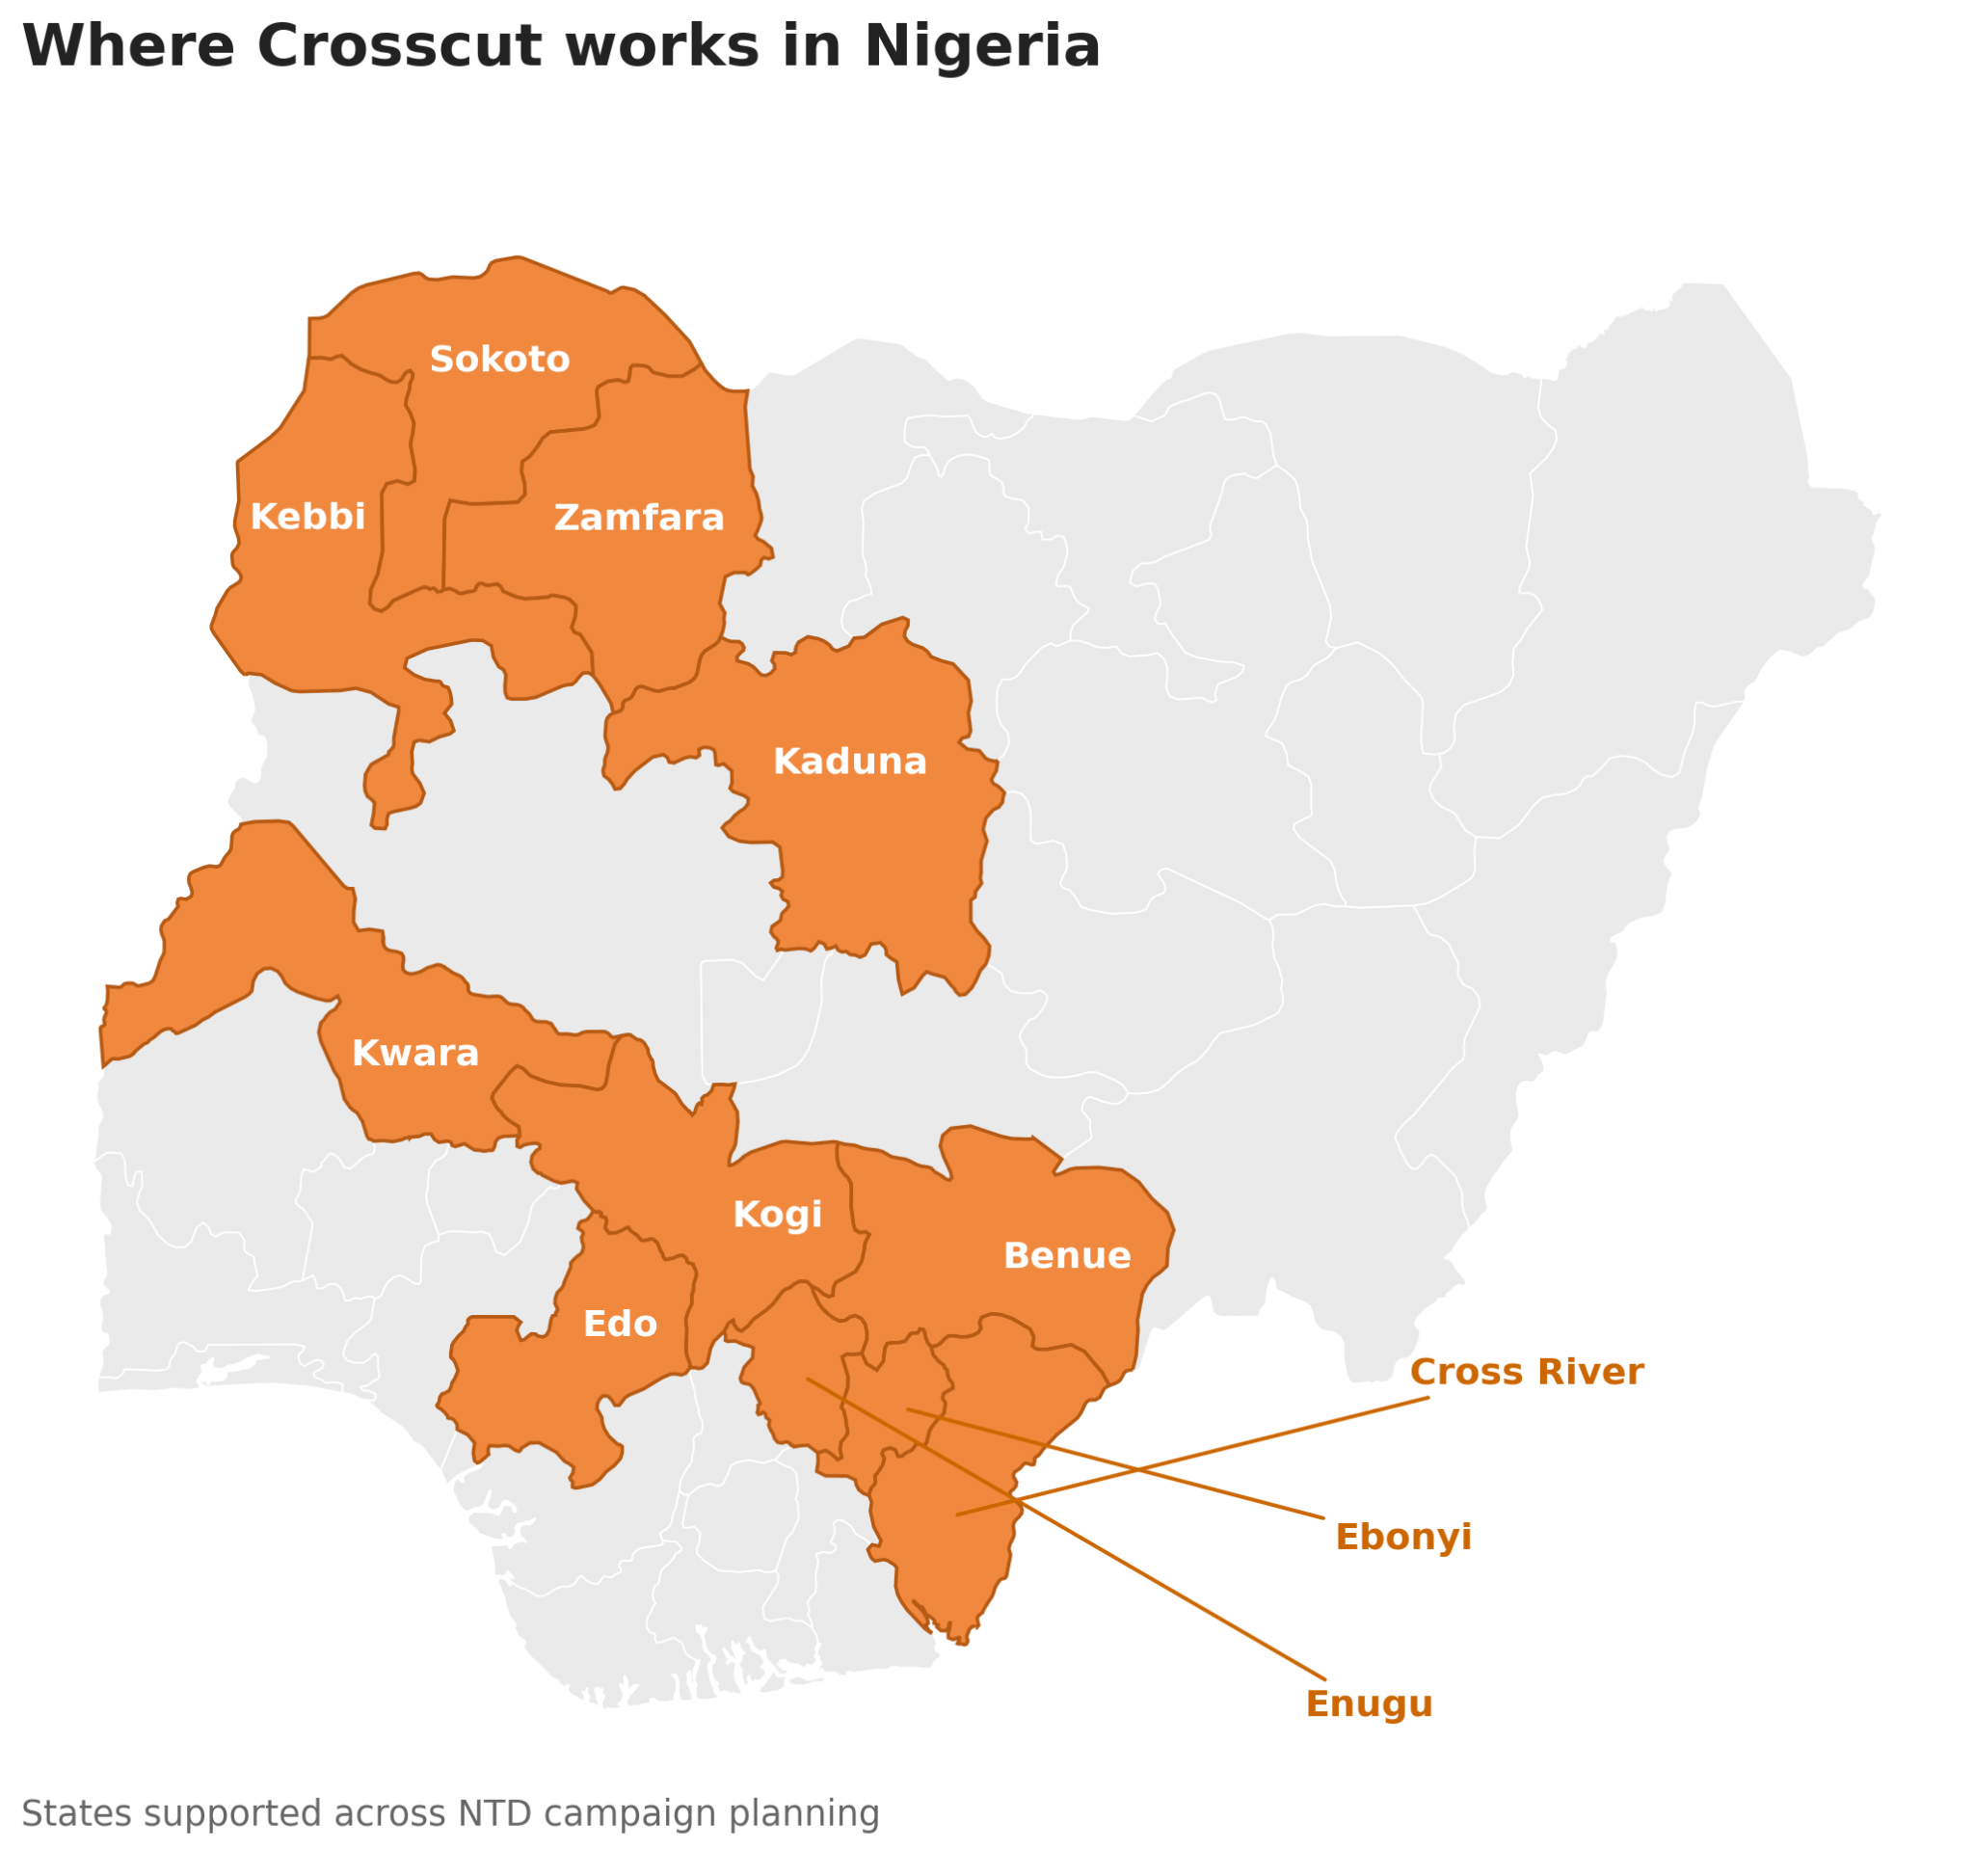
Where we work, and who we work with
Our Nigeria work runs through two main partnerships. In Edo, Enugu, and Ebonyi, we support the Carter Center and the Federal Ministry of Health on onchocerciasis campaign planning. Our schistosomiasis work with Sightsavers and state Ministries of Health began in Kogi in 2025 and expanded in 2026 to Benue, Kaduna, Kebbi, Kogi, Kwara, Cross River, Sokoto, and Zamfara.
The Edo, Enugu, and Ebonyi work began with a two-day, in-person training with myself and around 50 program staff. The Kogi work last year ran fully remotely, with two members of the Sightsavers team learning the tool, generating the analyses alongside me, and presenting the recommendations to the Ministry themselves. The overarching goal across all of these projects is to put the planning in the hands of the people running the campaign.
Finding the communities that get missed
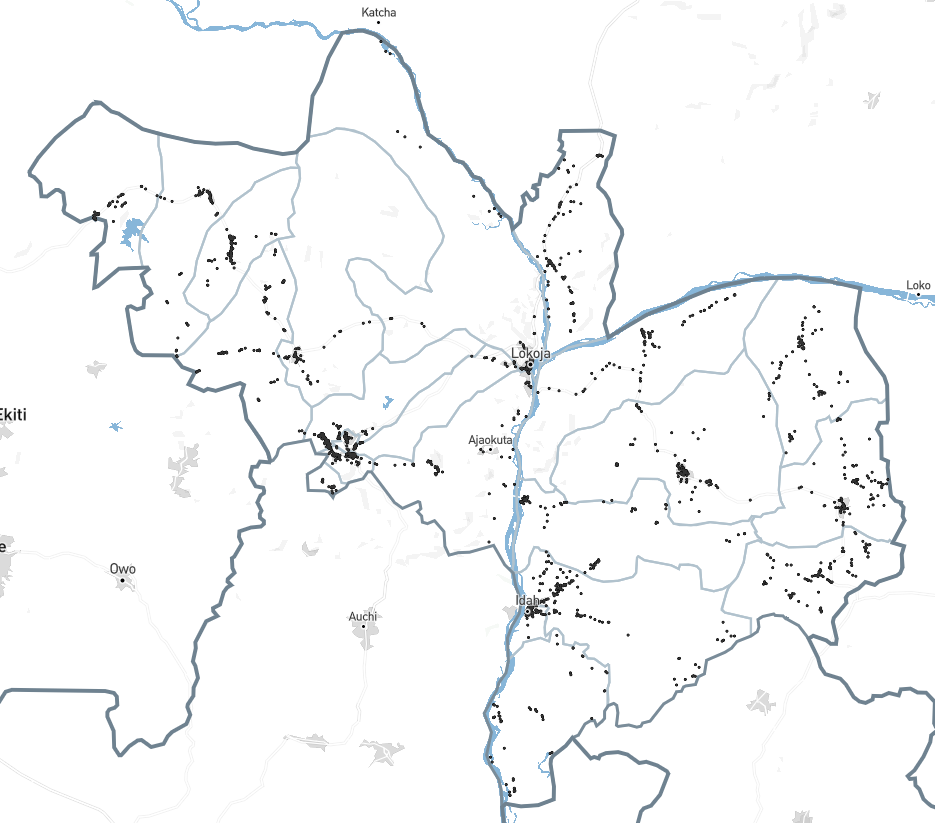
The first job in both country projects was to find areas that may have been missed during previous campaigns. During a campaign, community drug distributors (CDDs) deliver treatment while supervisors travel the same areas to verify the work was done. A supervision gap is an area no supervisor reached, which means no one confirmed whether those areas received services.
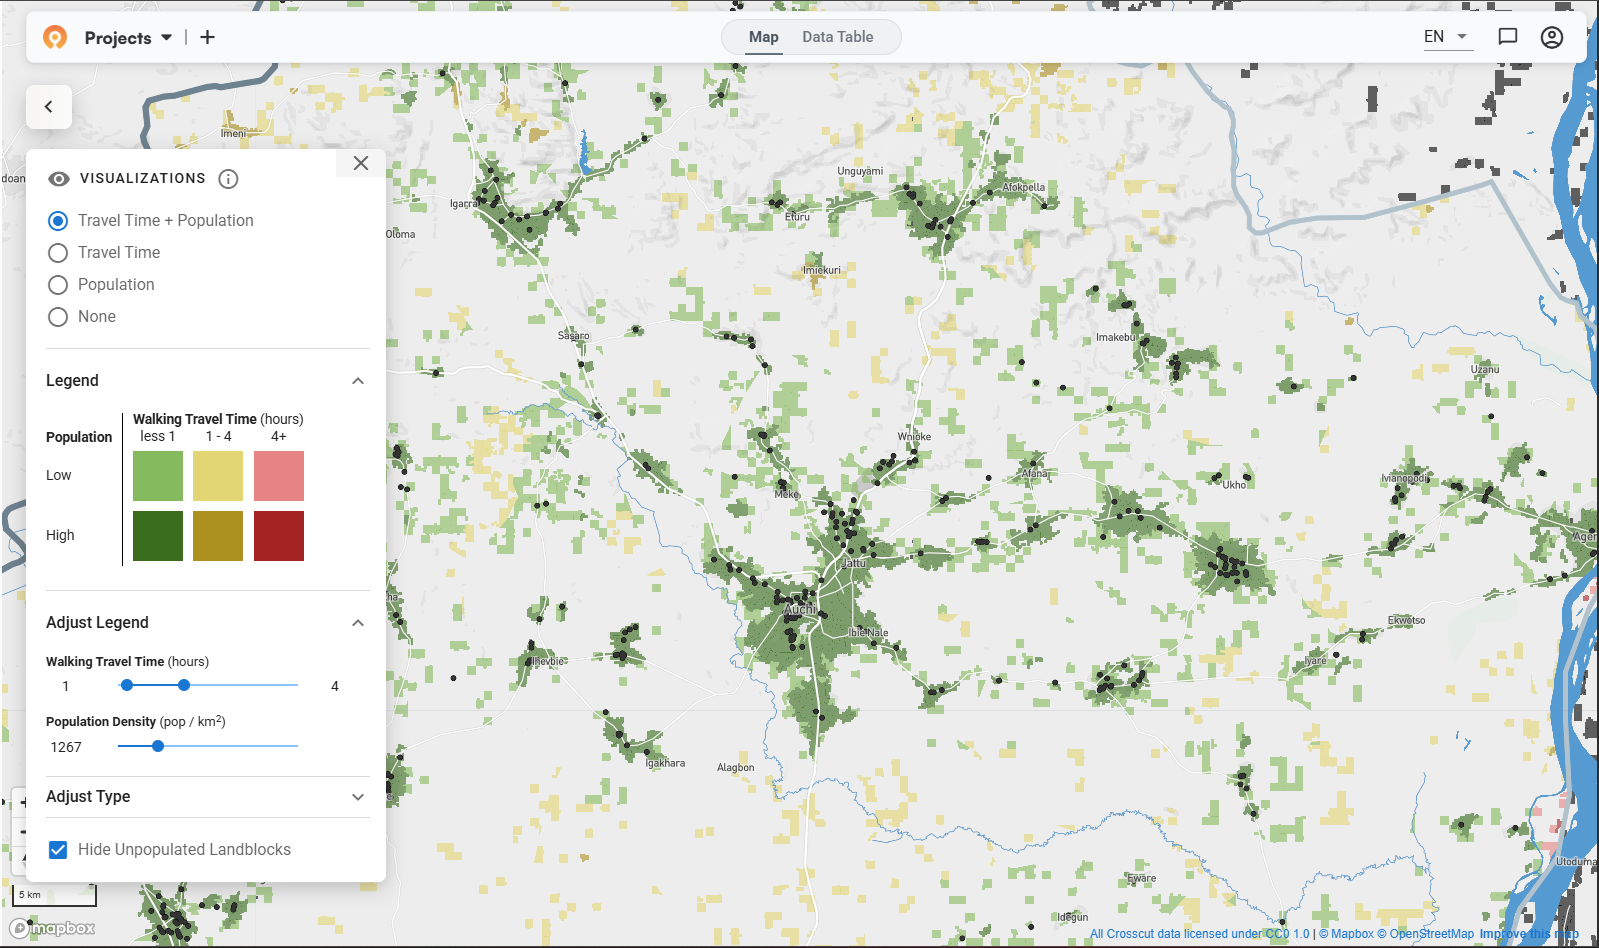
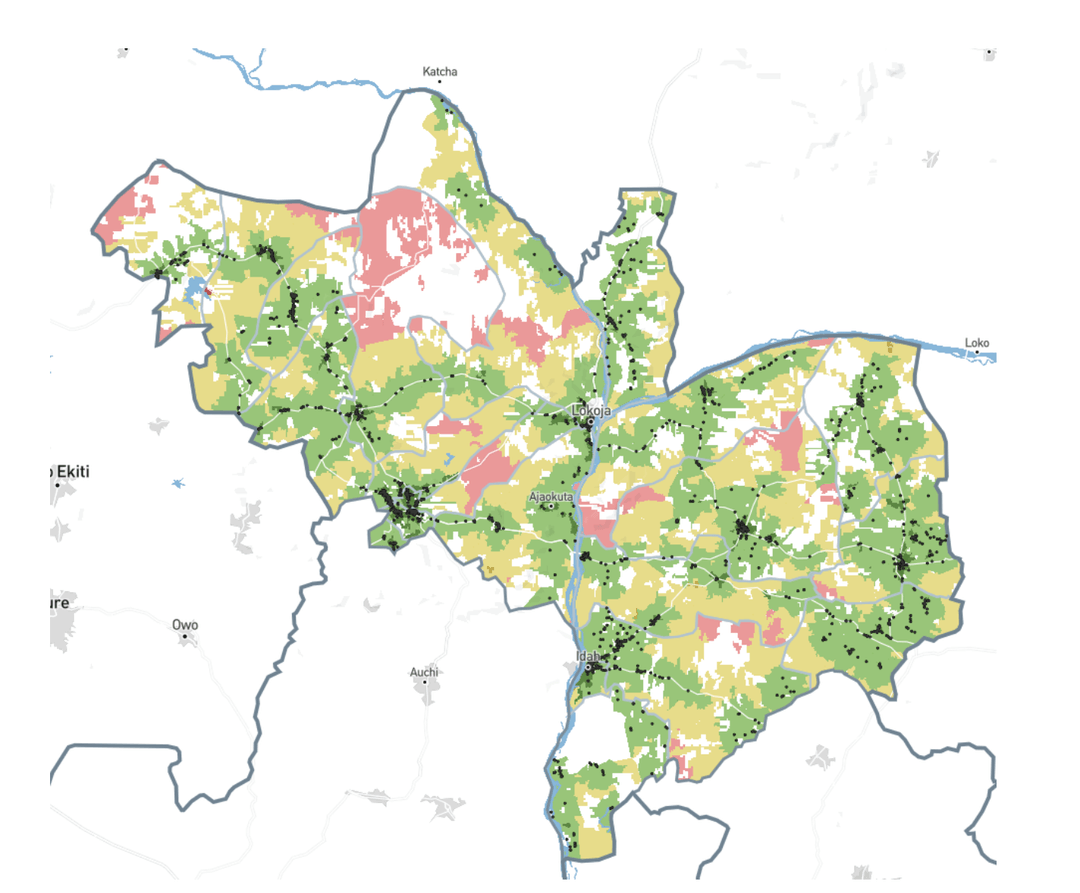
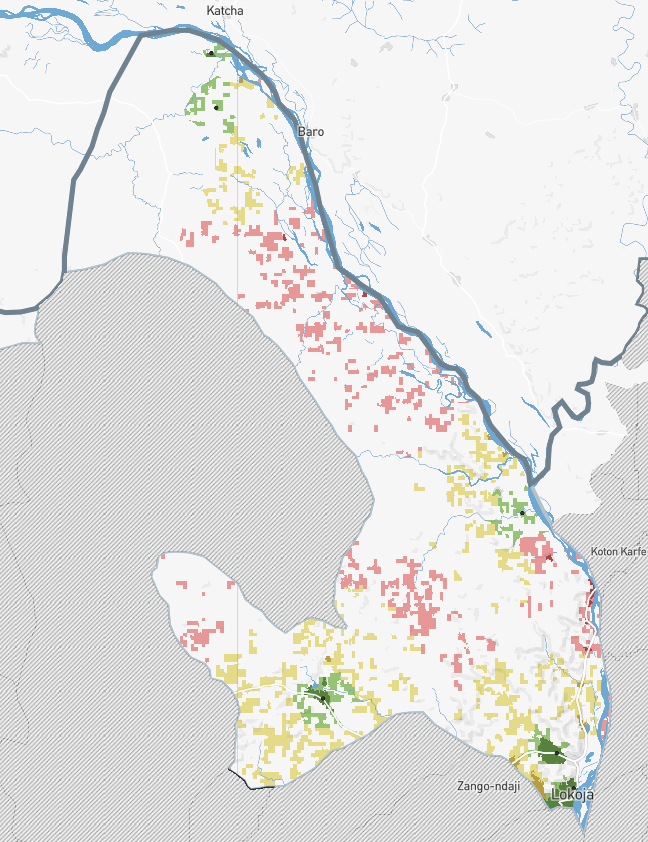
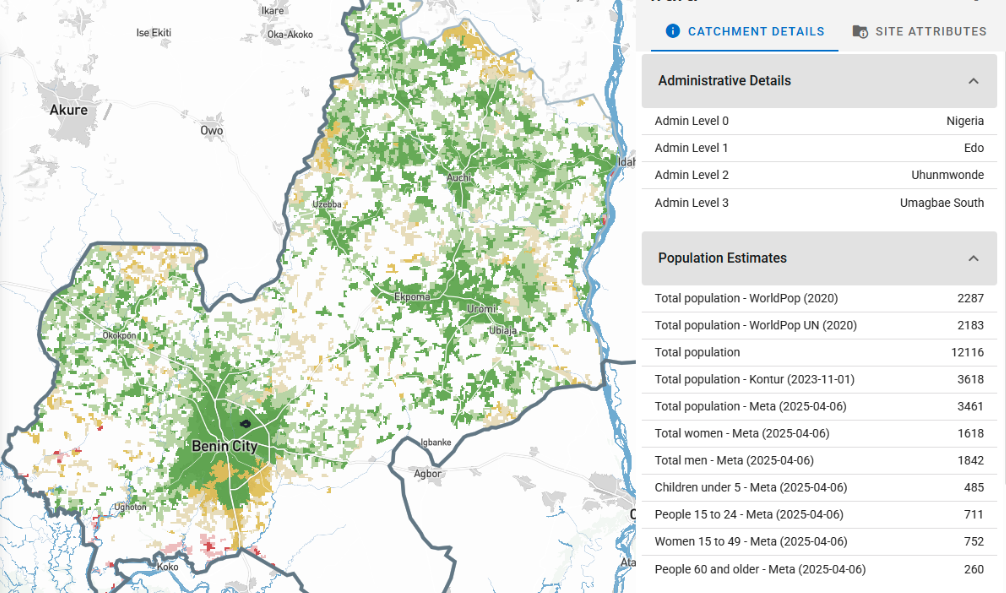
Supervisors record their visits with data collection tools like CommCare, and every visit carries a GPS location. We take that field data and turn it into a coverage heat map built around the black dots that represent each visit.
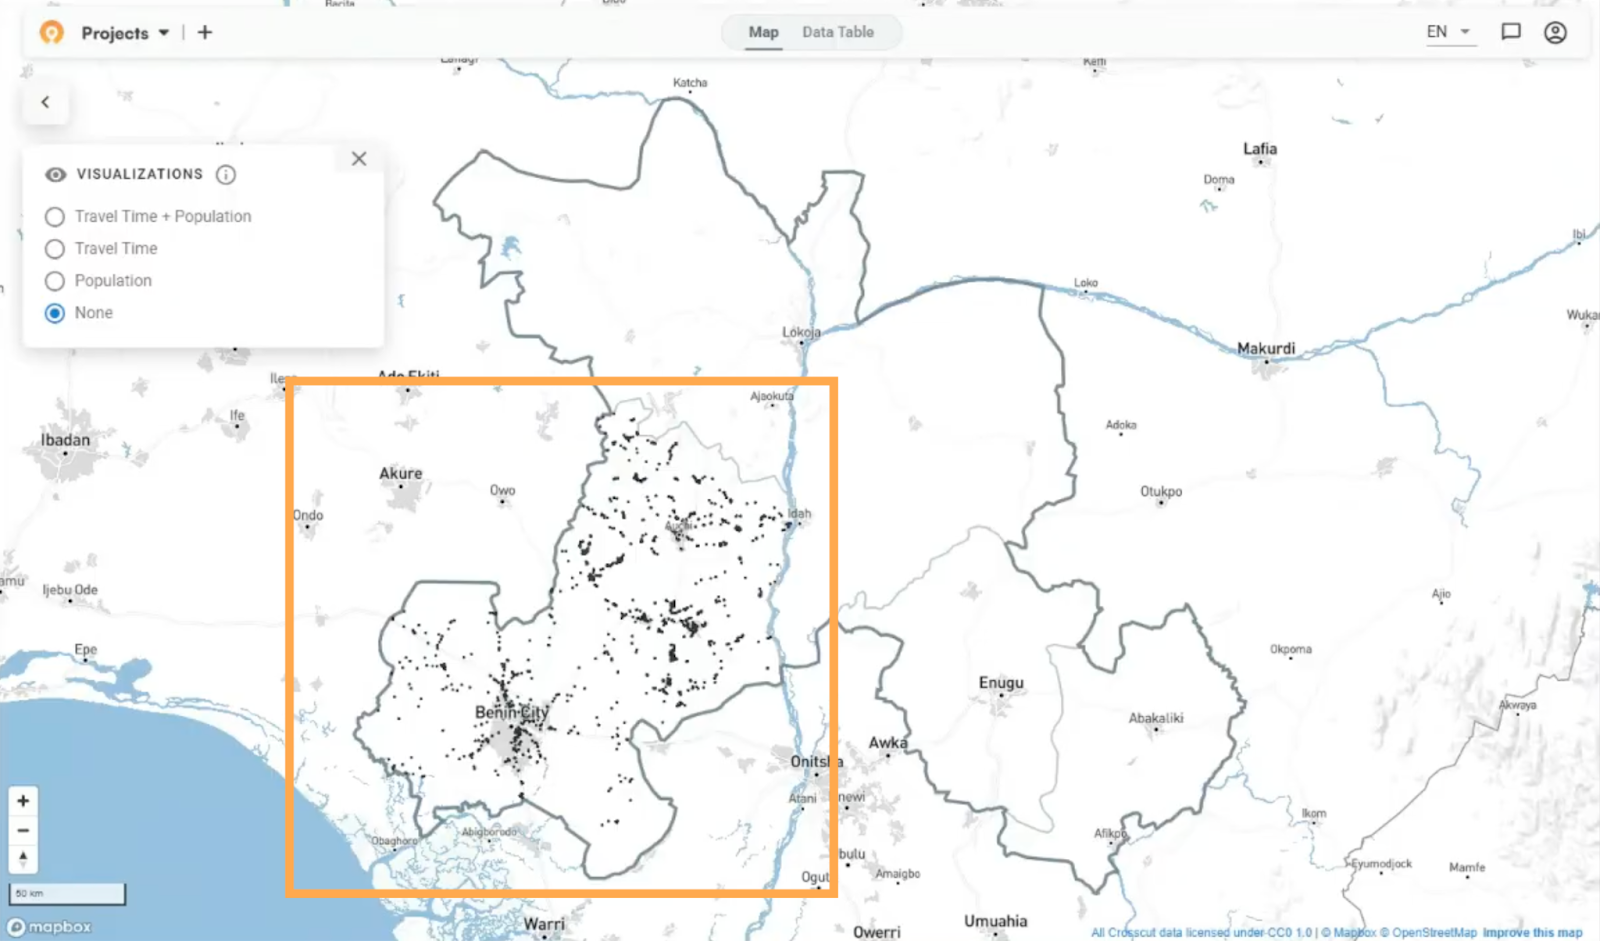
Red indicates communities more than four hours from any supervision visit, yellow for one to four hours, green for under an hour. Red zones are the priority list for the next campaign. A district health officer can quickly see where to send supervisors first, instead of guessing from last year's spreadsheet.
In Kogi, the teams used the same method to figure out where to hold trainings. Before a campaign, CDDs and supervisors travel to primary schools for several days of training, and Kogi's policy says no one should walk more than two hours to get there. Previous campaigns had drawn complaints about the distances.
We measured how far each community sat from its nearest training site and proposed eight additional schools to cover the communities facing the longest walks. It was the same underlying calculation to answer a different question.
Building supervisory areas that hold up
Once you know where the gaps are, someone has to be responsible for closing them.
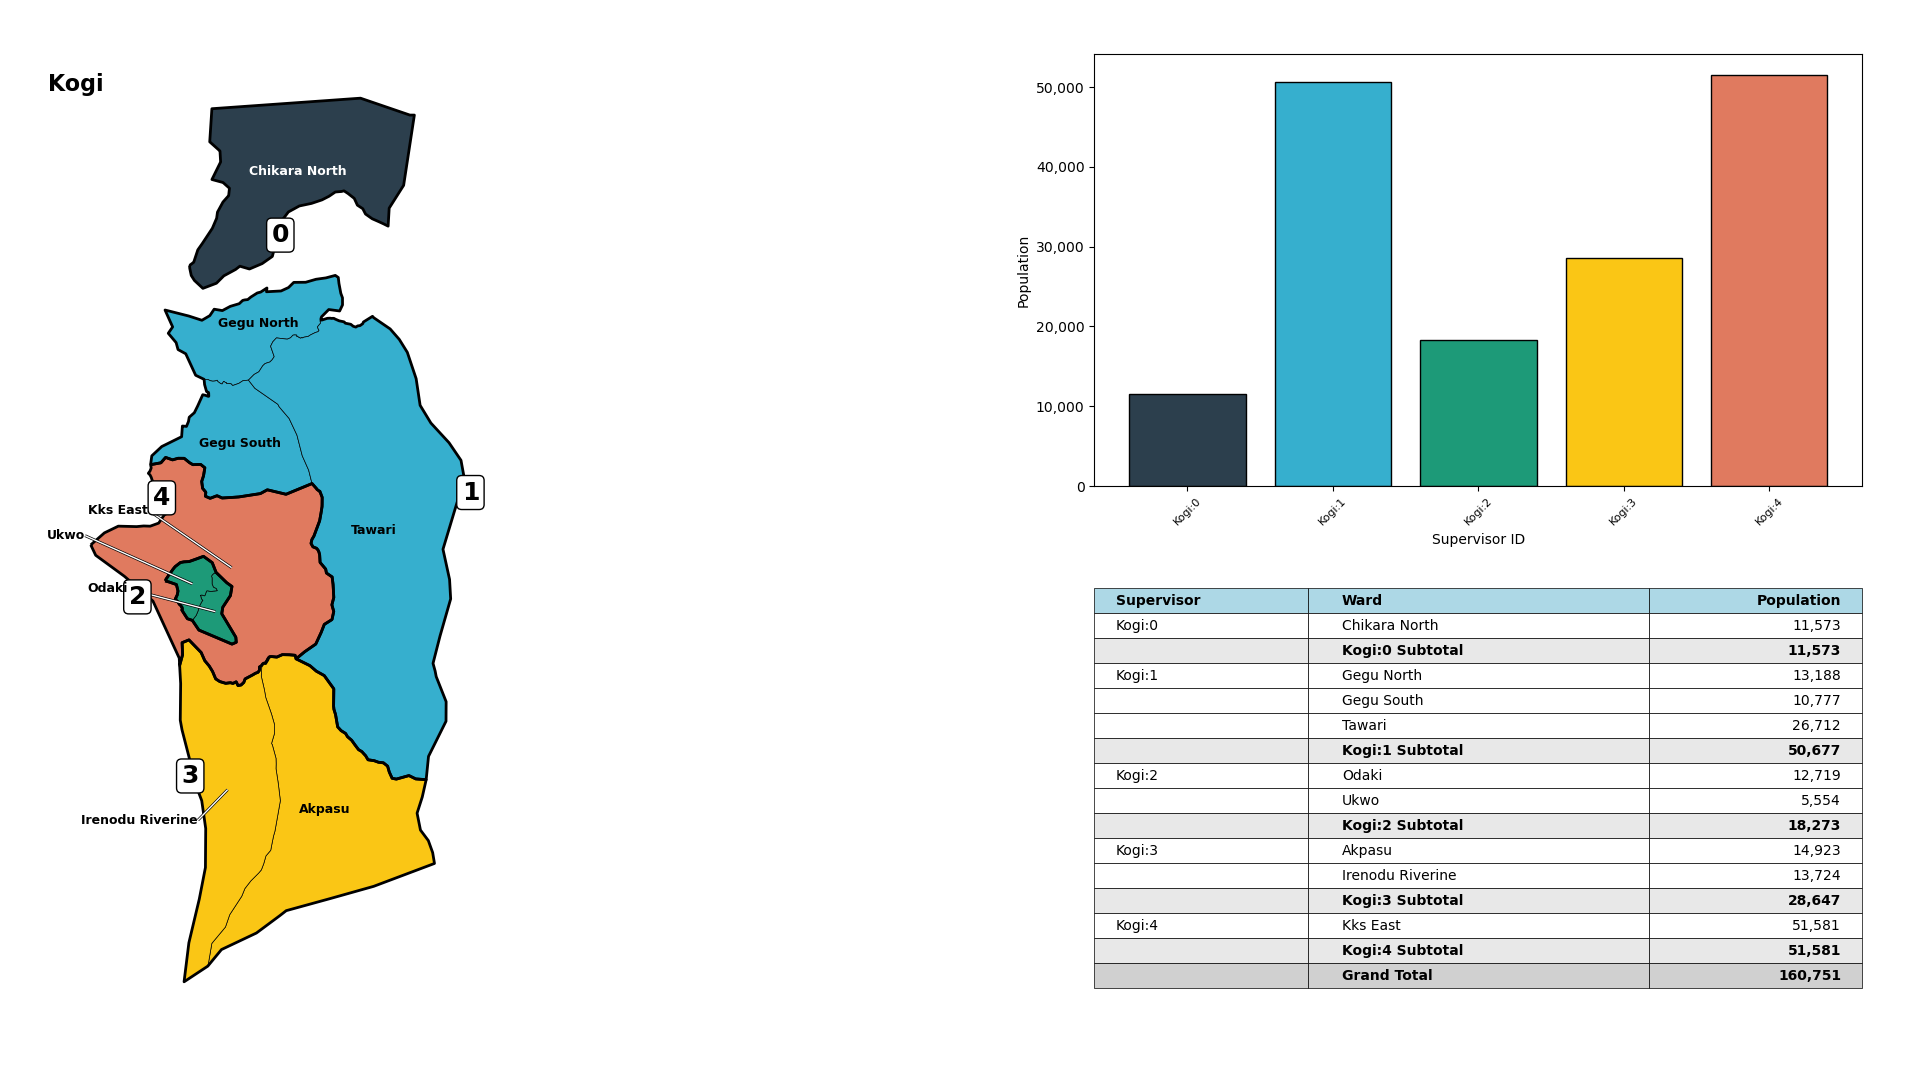
In Kogi, the Ministry assigns five supervisors per local government area (LGA) and wanted each one to own a set of whole wards rather than split territories into smaller pieces. Our standard fair supervisory areas tool balances population and travel time automatically, and for Kogi I adjusted it to build from wards instead of settlements.
The first version balanced the numbers as evenly as the ward boundaries allowed. Then the Ministry asked for one change: their staff knew a different grouping of a few wards would be easier to manage on the ground. The populations came out slightly less even, but the local team knows the ground better than any algorithm does, so we used that data instead.
The Crosscut App gives supervisors a strong starting position. But it still makes it easy to learn from the people who run the campaign, and implement those changes into the broader strategy.
Connecting the maps to the systems teams already use
Catchment area maps are no help if they live in a separate tool no one opens. We built solutions for Nigerian teams to fit the systems they already depend on, like email and Excel and data collection tools. Supervision data flows in automatically from CommCare and ODK, so coverage maps refresh daily during an active campaign without anyone exporting a file by hand.
And the Crosscut App integrates with DHIS2, the platform most countries use to manage their national health data. As a vetted DHIS2 Technology Partner, it can publish catchment boundaries and population estimates straight into DHIS2, where they sit alongside the reporting data many programs already collect.
As the funding picture shifts, more of this campaign planning is moving into the hands of Ministries of Health and their partners, who need to run it themselves, year after year, without a GIS specialist on call. Tools that depend on outside experts do not survive that handover. Mapping tools that are easy to use and that country teams can run on their own can and do.
One foundation, one tool, many health campaigns
The steps are the same no matter which disease a campaign targets. You map where people live, estimate how many there are, work out who can reach them, and split the work accordingly. Our Nigeria projects run those steps for neglected tropical diseases (NTDs), but the same method plans a malaria campaign or an immunization drive just as well.
We have put this method to work on malaria in several countries. On the PMI Evolve project, we helped teams in Ghana and Uganda plan indoor residual spraying and net distribution, down to estimating how much insecticide each spray site would need. We also built malaria microplanning tools to Alliance for Malaria Prevention standards, then used the same setup for immunization campaigns.
What comes next in Nigeria
The work in Edo, Enugu, Ebonyi, and Kogi started as pilots, and the real test of a pilot is whether it becomes part of how a program plans every year. We’re now less focused on running a single analysis, and more on leaving teams with workflows they own and repeat. Each project also feeds our monitoring and evaluation work, which tracks whether supervision coverage and campaign reach actually improve over time, not just whether the tools get used.

Plan your next health campaign in Nigeria
Beyond Nigeria, we work alongside Ministries of Health and partners like Sightsavers and the Carter Center to plan campaigns across the WHO African region, and we walked NTD program managers through the tools at ESPEN's annual meeting in Lilongwe. If your program is planning campaigns in Nigeria or anywhere else, the Crosscut App is free to use, and the ESPEN Geospatial Microplanner is available across the region.
For programs that need a heavier lift, a custom microplanning or catchment mapping solution, a supervisory structure we have not built yet, or work wired into a national system, that is what our Advisory Services are for. You can also reach us directly through our contact page.
Related Posts
An independent evaluation of the Crosscut App
.JPG)

How to set up a Microplan Collector project in the Crosscut App

May 2026 updates: Shared microplan projects and easier supervision analysis