
Choosing the right catchment area mapping method in the Crosscut App

Health campaigns run on questions about geography. Which communities can reach this clinic? How do we split a district into fair workloads for our teams? Where do people live, and how should we group them? The right method depends on the question you are trying to answer.
How the Crosscut App creates catchment area maps
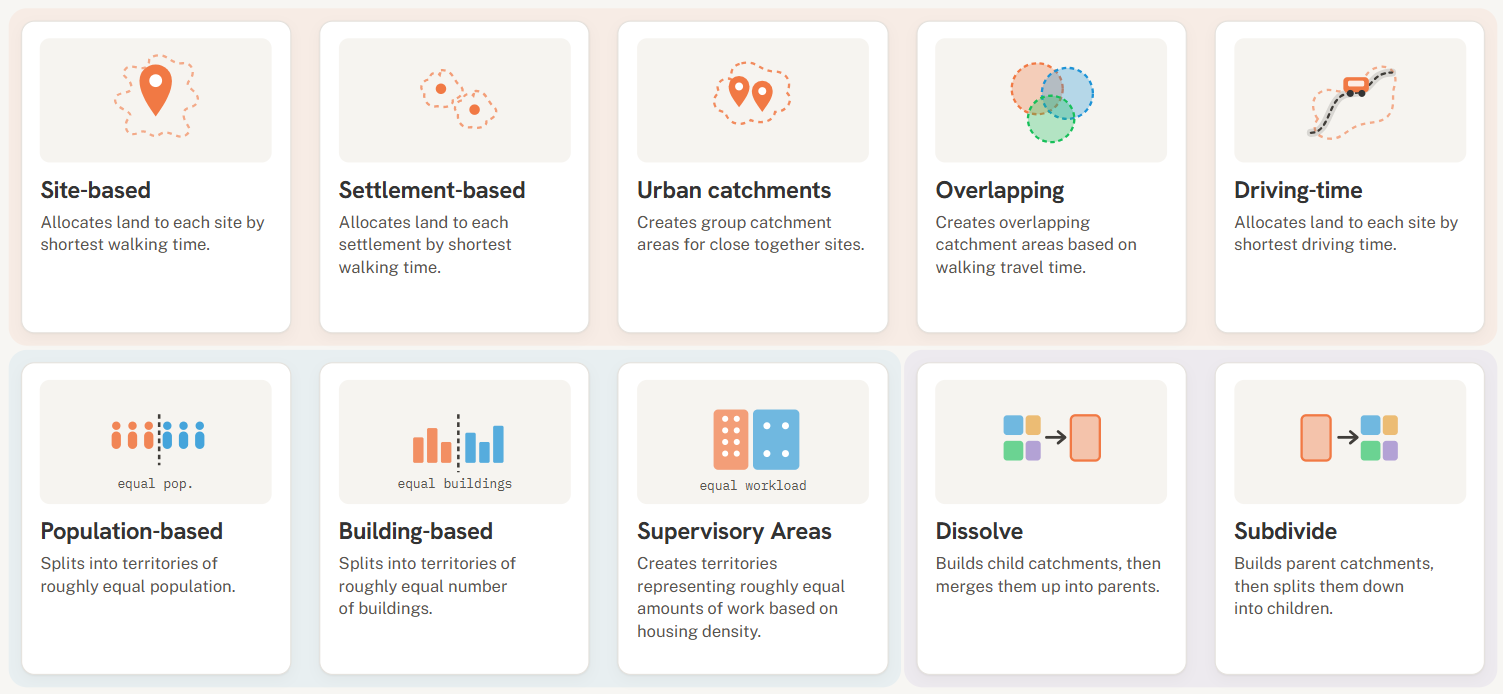
The Crosscut App has eight algorithms for building catchment areas. The grouping splits into two main types and one subset based on what they do and what your program needs:
- Accessibility catchment areas measure reach: who can get to a site, and how far a site's service extends across real terrain like roads, rivers, and administrative borders.
- Clustering catchment areas divide a space into balanced territories of roughly equal population, buildings, or workload for teams on the ground.
- Once you have catchments, you can also combine them into bigger areas or split them into smaller ones.
You don't need to learn all eight algorithms to use the Crosscut App, because the interface itself walks you through how to fit your data and your question. This guide covers what each one does for a better understanding of what's possible before you start.
Accessibility catchment areas
This group of algorithms measure how far people need to travel to reach your site. Every boundary considers how people traverse the real landscape, so roads are fast, forests are slow, and rivers and slopes get in the way. You supply your sites or target area, and get catchment areas built from real travel time, which you can also view as a heat map to see who's close and who's far inside each one.
Site-based
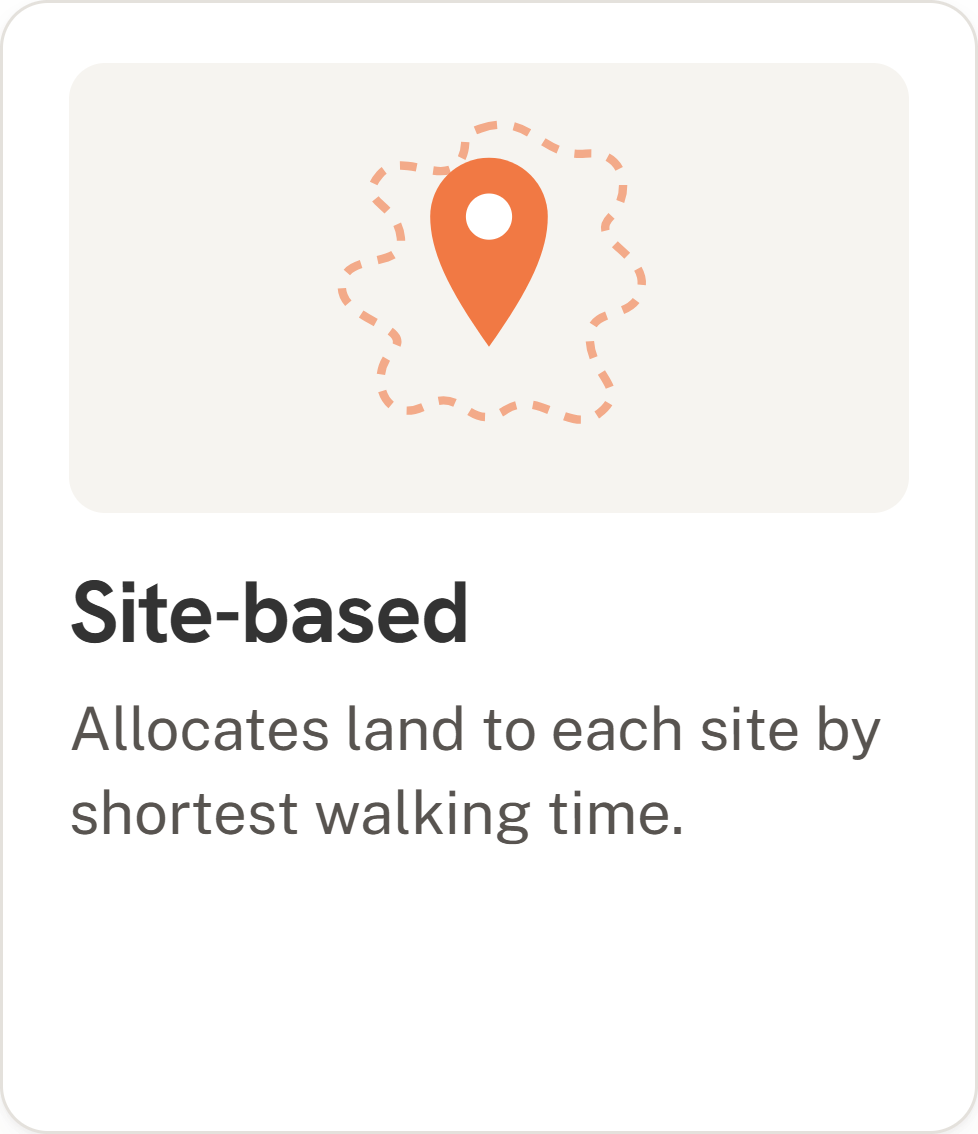
Allocates land to each site by shortest walking time.
Site-based allocates land to each site by shortest walking time. The Crosscut App takes your facility coordinates and gives each one a service area. This algorithm assigns every stretch of land to the site a person reaches fastest on foot. Boundaries bend around rivers, roads, and terrain, so you see which communities each site serves instead of a scatter of points.
Settlement-based
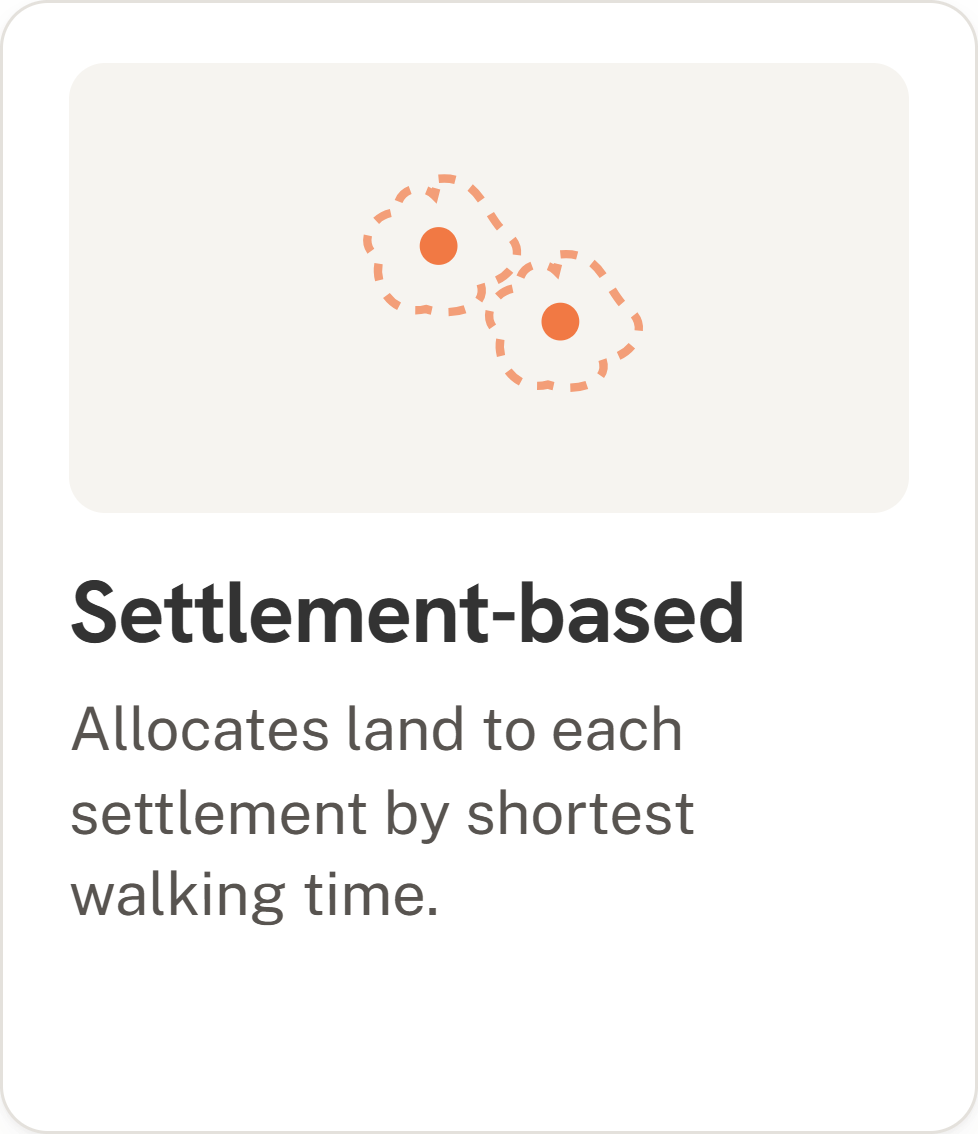
Allocates land to each settlement by shortest walking time.
Settlement-based identifies the largest settlements in an area and allocates land to each by shortest walking time. The Crosscut App reads where people already live, places a point at each population center, and grows areas outward by walking time. You choose how many settlements per administrative area. Fewer settlements per admin area give you broader coverage, more for finer detail.
Urban catchments
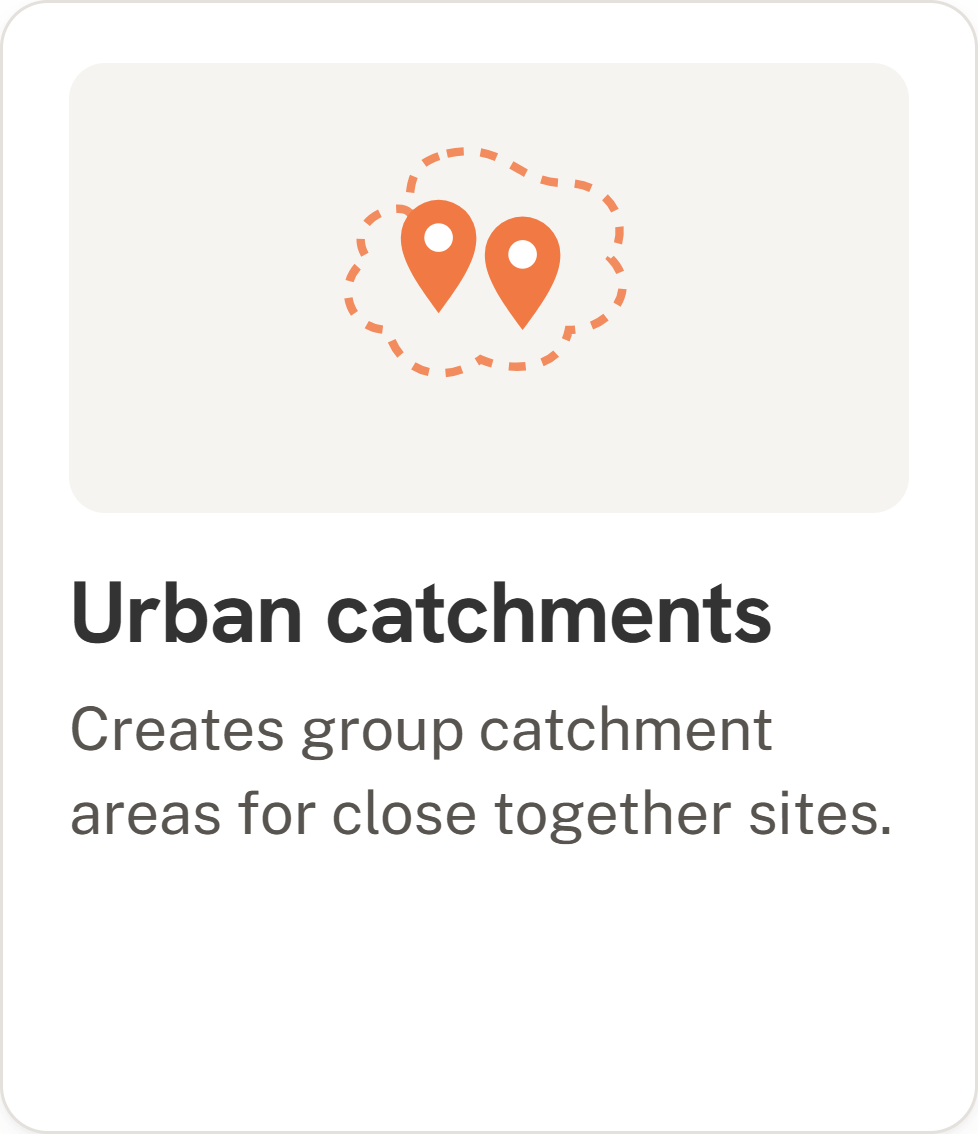
Creates group catchment areas for close-together sites.
Where the site-based algorithm gives every facility its own catchment, that stops making sense when facilities sit very close together. You end up with lots of tiny competing boundaries that split one neighborhood among several facilities that effectively serve it together. Urban catchments merge facilities that fall within a distance you set into one shared area, so a tight cluster reads as a single serviceable zone rather than a tangle of boundaries.
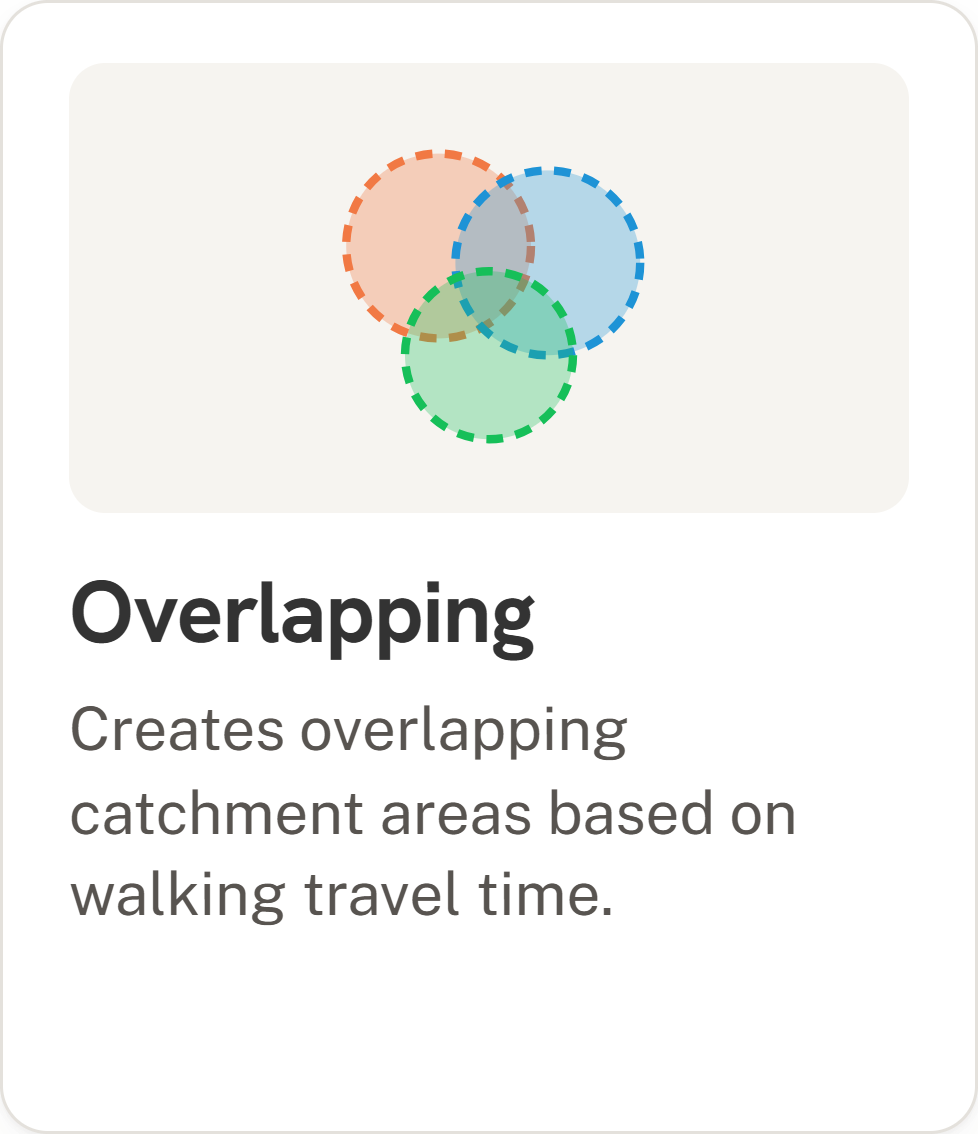
Overlapping
Creates overlapping catchment areas from walking travel time.
Overlapping creates overlapping catchment areas based on walking travel time. Most algorithms assign every community to a single site. This one instead draws a travel-time area around each site and lets those areas cross, which can also leave gaps between them. The result shows how many sites each community can reach within a set walking time.
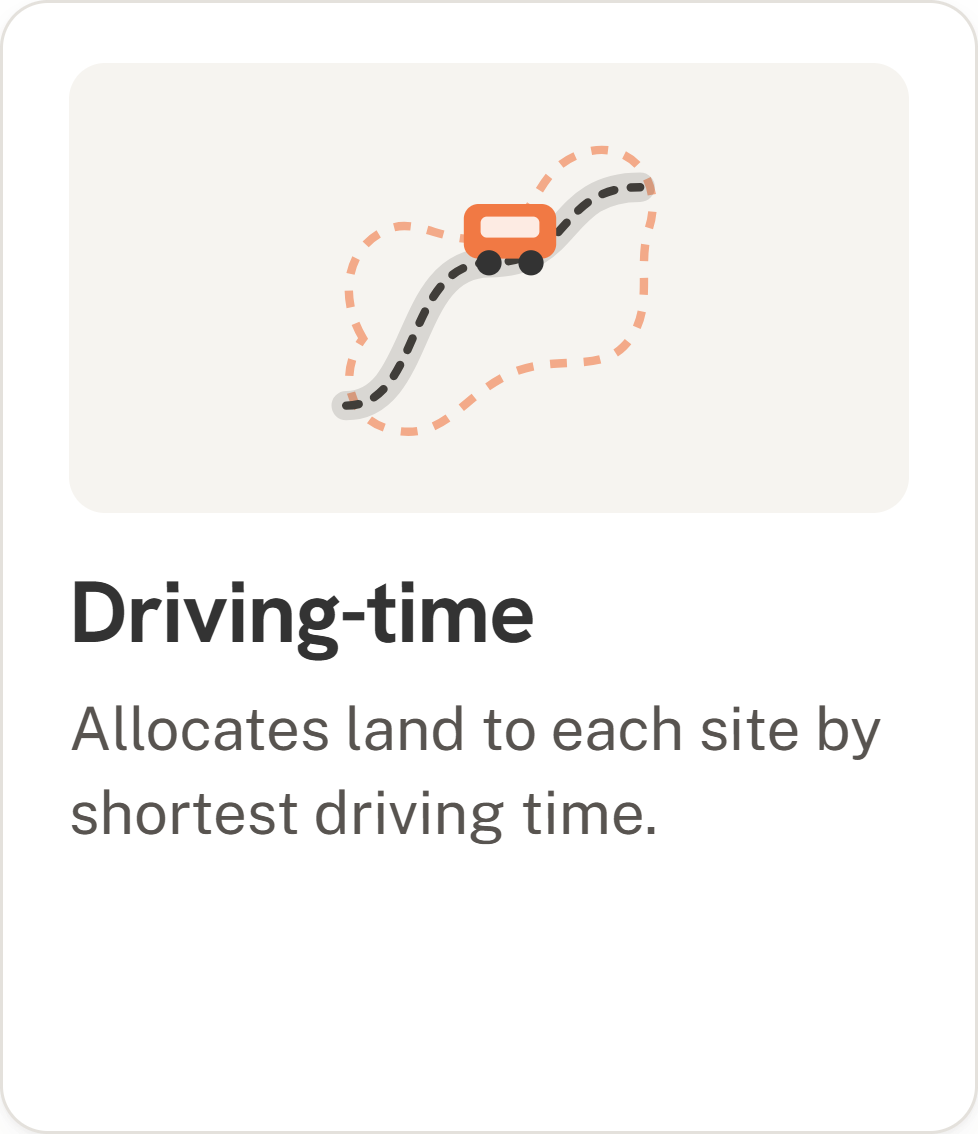
Driving-time
Allocates land to each site by shortest driving time.
Driving-time follows the roads and shows how far a vehicle reaches from each site within a set drive, like Google Maps. Where walking methods model travel across open terrain, driving-time sticks to the roads, which fits supply runs, referrals, and anything else moving on wheels.
Clustering catchment areas
Rather than measuring reach from a point, clustering algorithms divide a space into balanced territories. You set the target, whether population, buildings, or workload, and the Crosscut App carves the area to those parameters. These algorithms use the same population and building data as the accessibility model, so catchments reflect where people and structures really are.
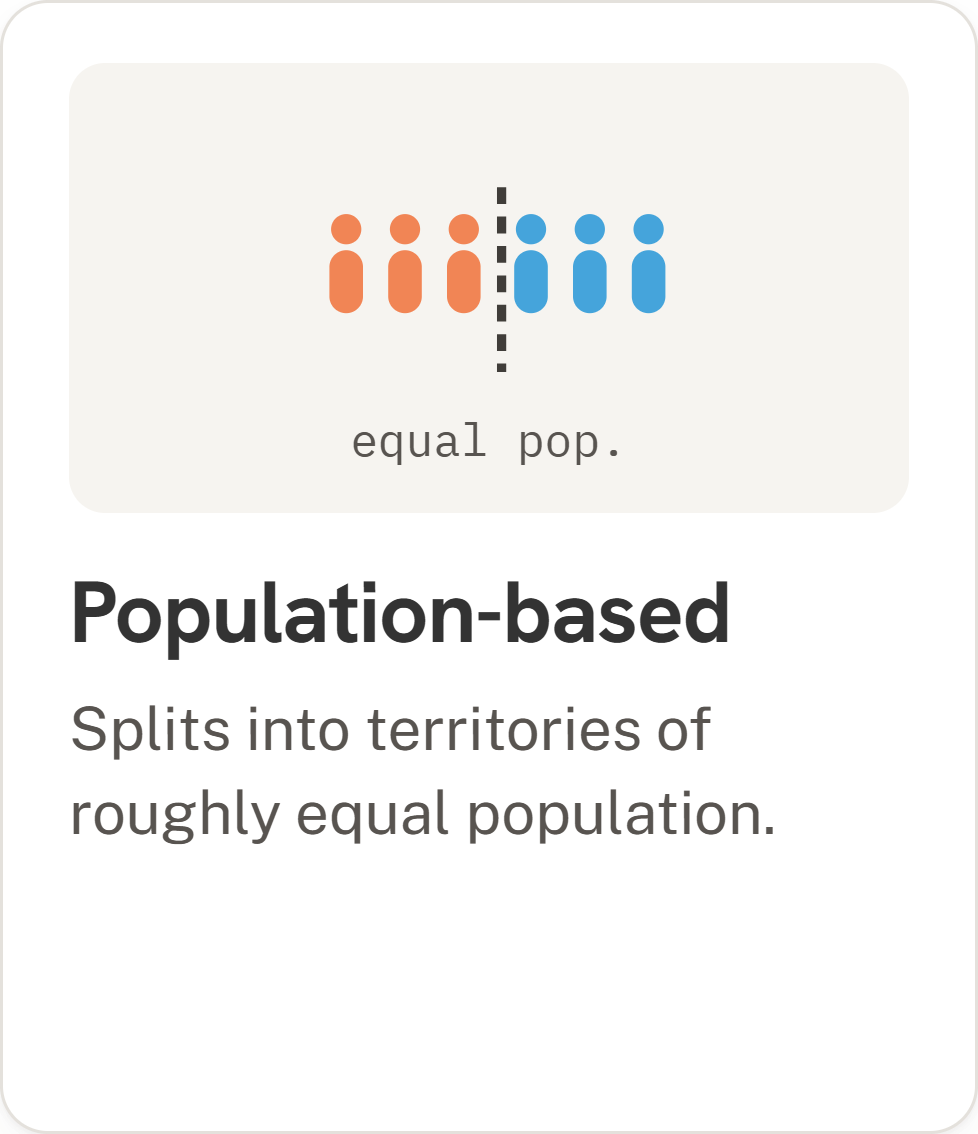
Population-based
Splits into territories of roughly equal population.
Population-based splits an area into territories of roughly equal population. You set a target population per territory, and the Crosscut App partitions the land to reach that mark. You get balanced groups of people without having to draw or discuss a single boundary by hand.
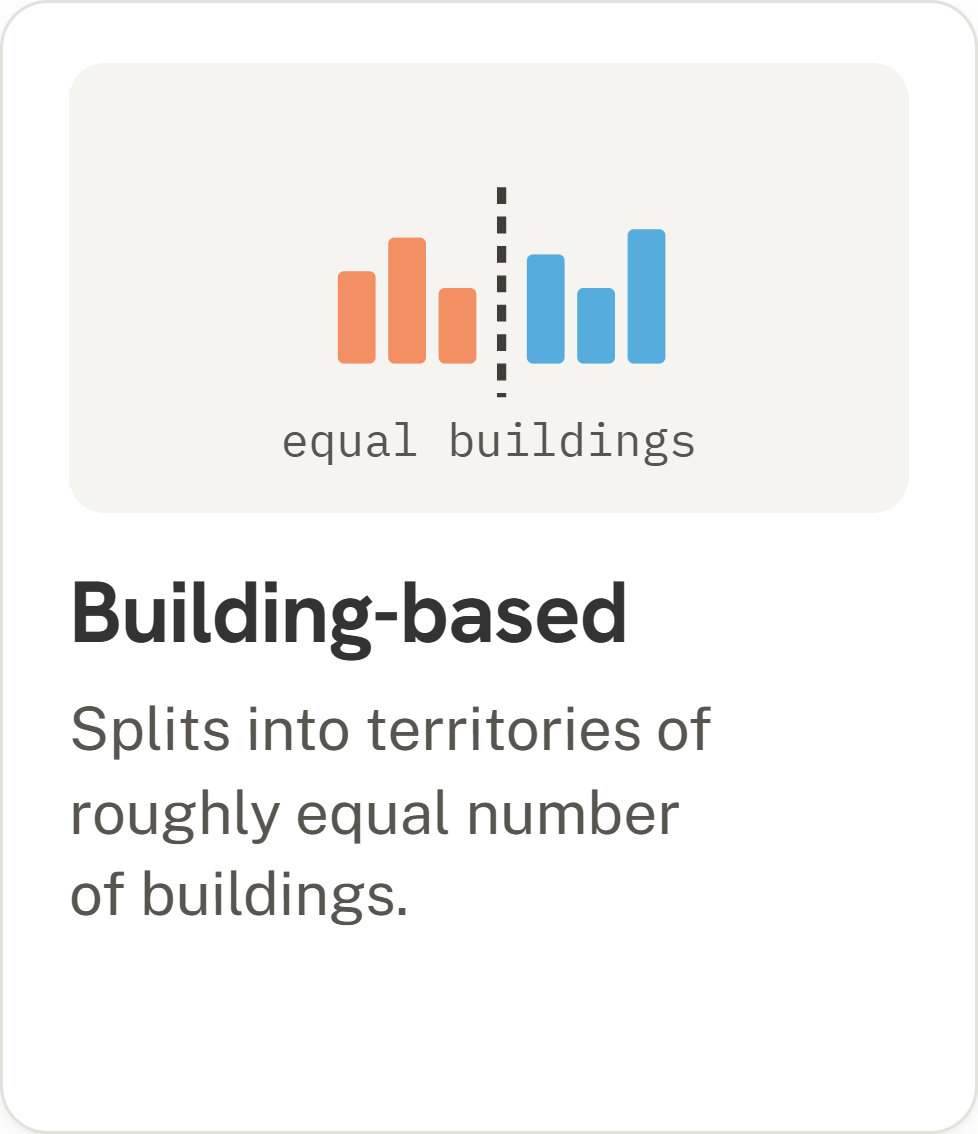
Building-based
Splits into territories of roughly equal building count.
Building-based splits an area into territories of roughly equal building count. It works like population-based but balances structures instead of people. These counts suit activities where the number of structures drives the workload more than people, as in indoor residual spraying campaigns.
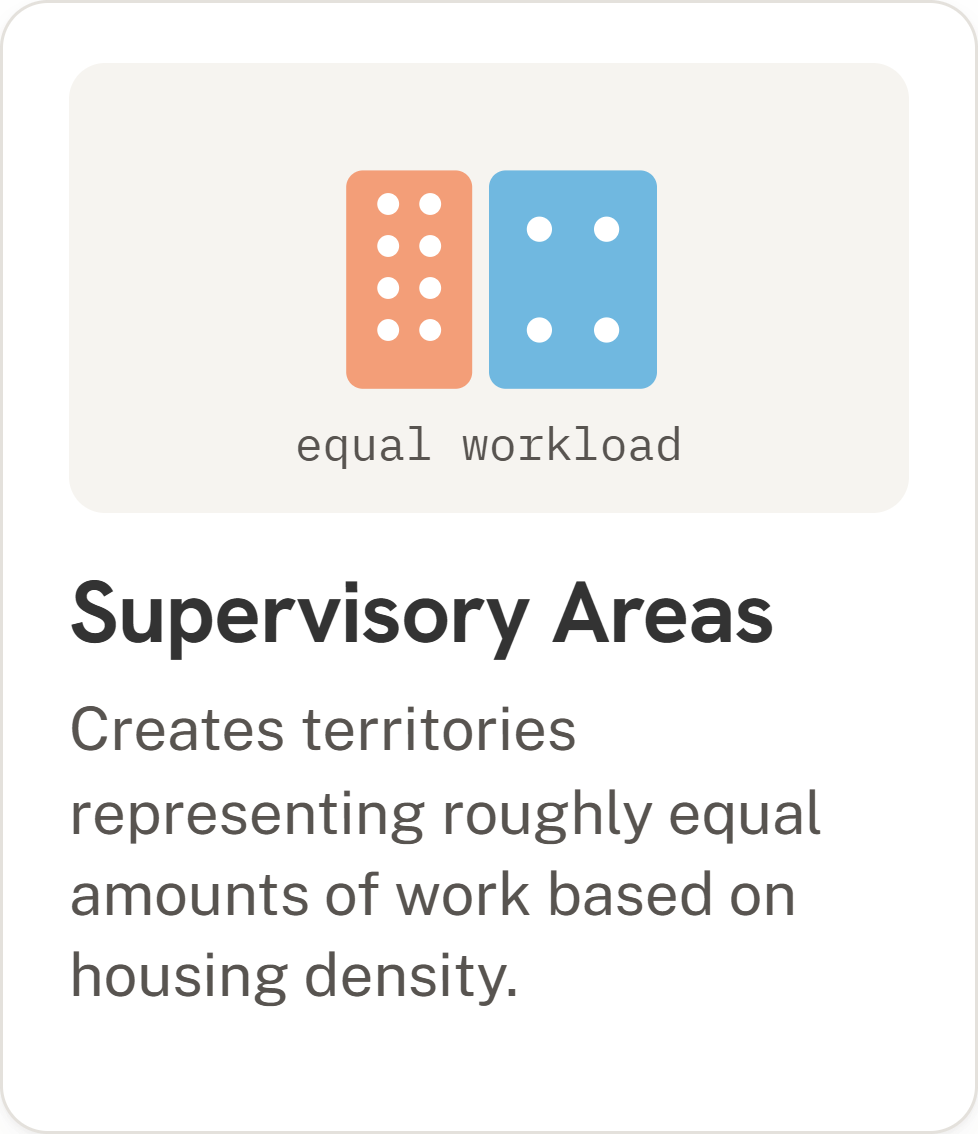
Fair supervisory areas
Territories of roughly equal work, from housing density.
Supervisory areas create territories of roughly equal work for those delivering services or doing oversight. Because rural teams lose more of the day traveling between houses, the algorithm hands them smaller populations than urban teams, so everyone's workload comes out about even. If you know your staffing, enter your community drug distributors and supervisors and it balances the territories among them. If you're still planning, enter target ratios, such as one distributor per 250 people and one supervisor per eight distributors.
Two-tier catchment areas
A single layer of catchments tells you which area belongs to which point, but most programs work at more than one level at once. Community health workers report up to a facility, that facility up to a district, and so on up the chain. A single flat map can't show all of those levels together, so teams usually end up keeping separate maps that never quite line up. Two-tier catchment areas solve that by integrating the levels, and they can work in either direction.
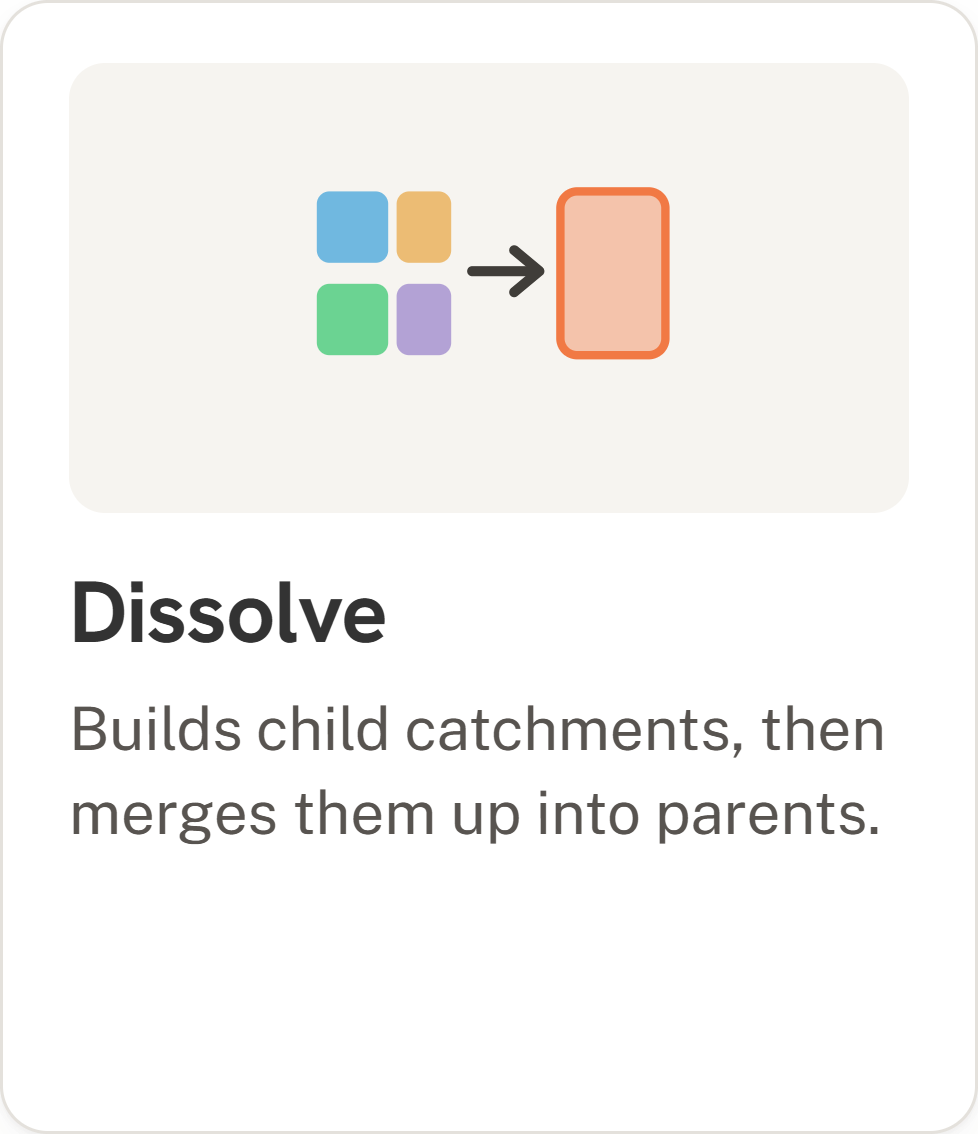
Dissolving
Merges smaller catchments up into a larger parent.
Dissolving works from the bottom up, merging smaller catchments into a larger one using a shared ID that's already in your data. If your records show several communities being served by the same facility, the Crosscut App combines those community catchments into a single facility boundary. You get the higher-level view without redrawing anything, and the parent boundary always matches the pieces underneath it. This is how you move from community-level detail up to the facility or district boundaries your program truly plans and reports against.
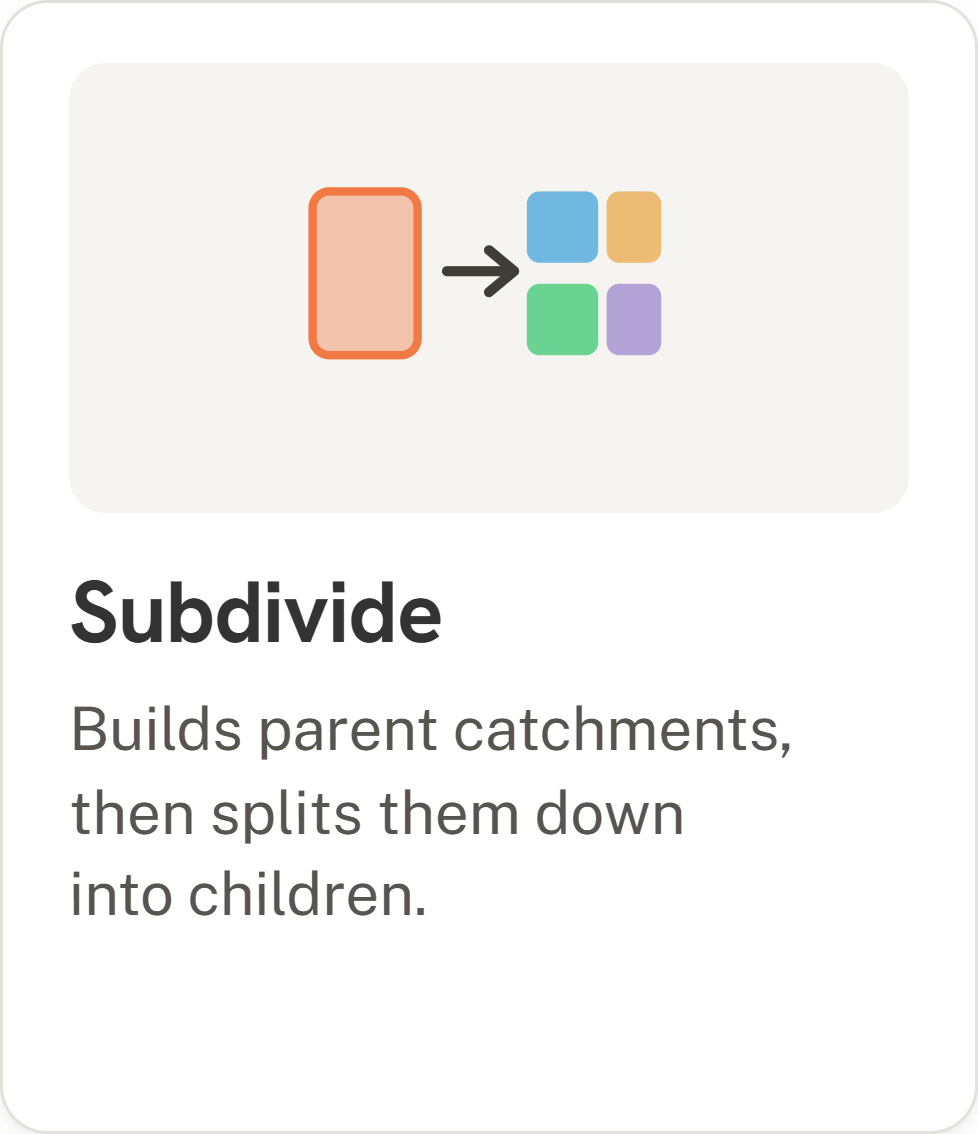
Subdividing
Splits one catchment into a finer layer beneath it.
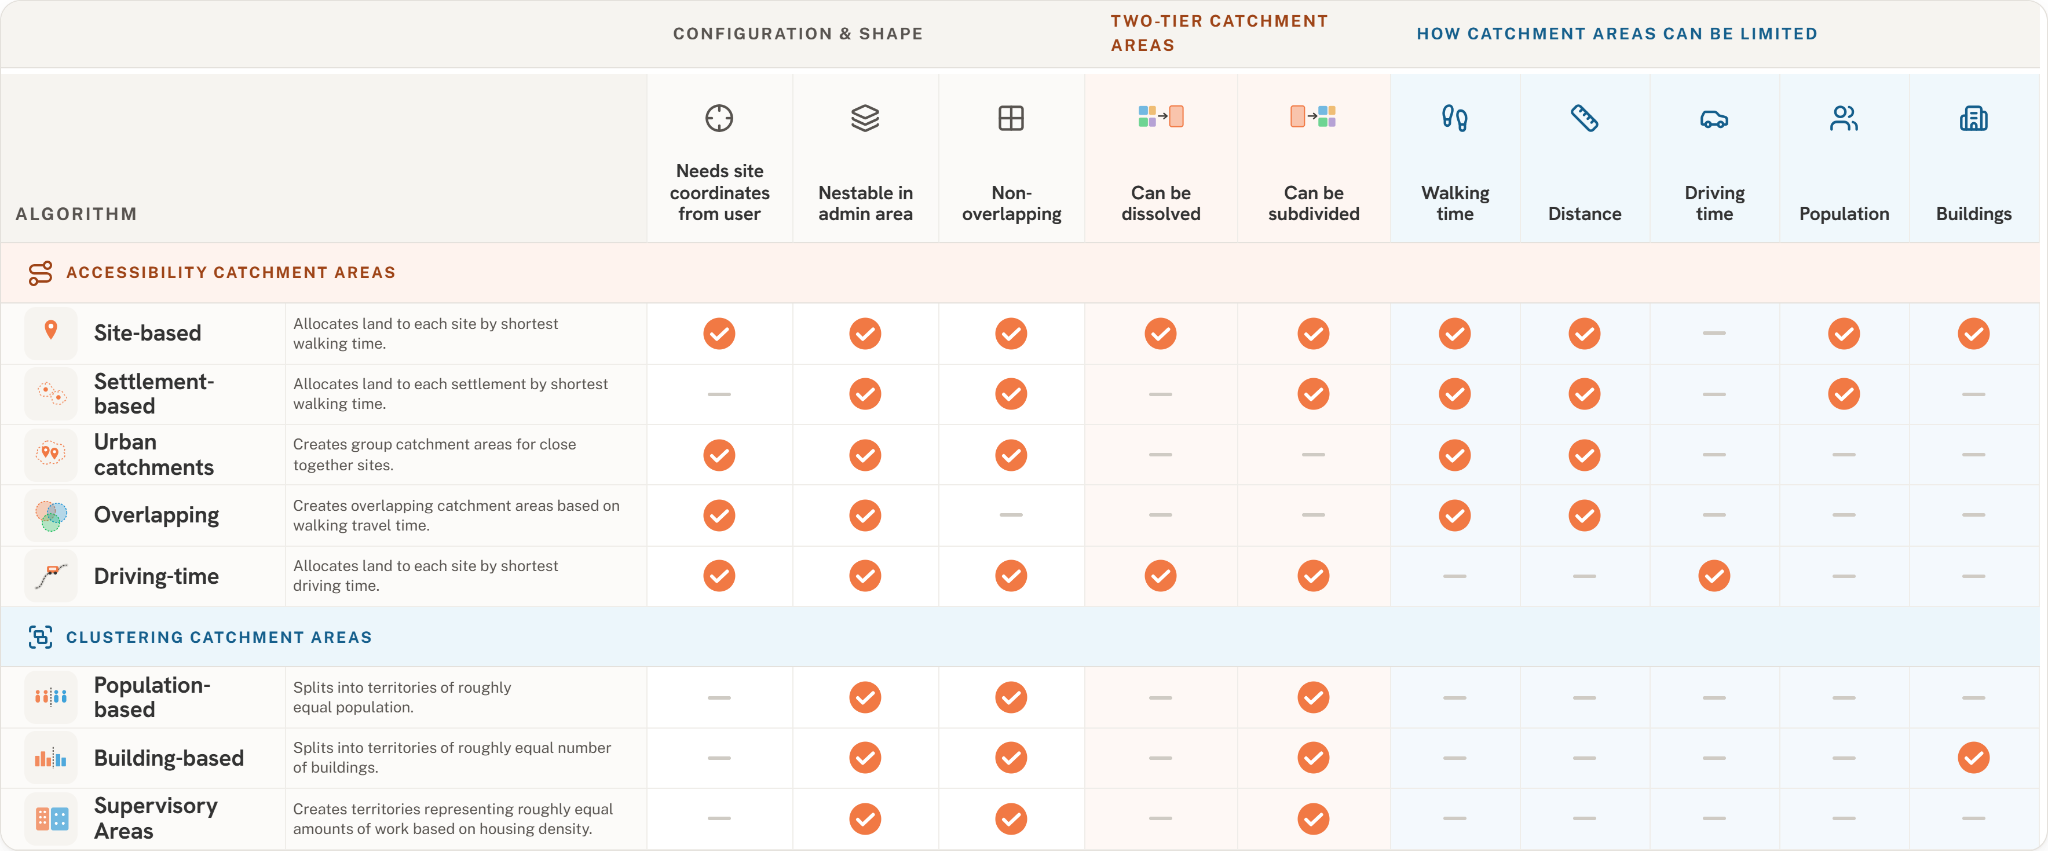
Subdividing works the other way, breaking one catchment into smaller catchments inside it. A facility catchment can be divided into the areas each drug distributor covers, or a supervisory area can be split into the smaller areas each team works. You build the larger catchment first, then divide it up, so the smaller areas always fit neatly inside the bigger one. The comparison table below shows which algorithms you can dissolve and which you can subdivide.
How each algorithm can be configured and sized
You can set a district, region, or country border and the app will keep every catchment inside it, so your map matches the areas your program already plans and reports around. The rest of the settings depend on which algorithm you pick. Accessibility catchments can be capped by how far people travel, whether that's walking time, straight-line distance, or driving time, while clustering catchments are already sized by the population or building target you set.
The table below shows which settings each algorithm supports, whether it needs site coordinates from you, and whether its catchments can overlap.
Which algorithm fits which program
The same algorithm can answer very different questions depending on what your program needs, weather for immunization, malaria, and NTD work.
These eight algorithms are built into the app, so you work with what you're mapping rather than picking one off a list. The Crosscut App is free, runs in any browser, and covers all Sub-Saharan African countries, so you can upload your sites and start without GIS software or a specialist on staff. If your program needs more specialized campaign planning help, get in touch.
Further reading
Getting started
- What is a catchment area map?
- How to create catchment area maps from GPS locations
- All Sub-Saharan African countries now available in the Crosscut App
How the algorithms work in the Crosscut App
- Site-based catchment areas in the Crosscut App
- Settlement-based catchment areas
- Fair supervisory areas
- Visualizing accessibility with heat maps
Building on your catchments
Technical breakdown
FAQs
What is a catchment area?
A catchment area is the geographic area served by a specific site, such as a health facility, school, or store. It answers the question of which communities depend on which location. In global health, catchment areas define which villages a clinic covers, which households a vaccination team is responsible for, or how a district splits into workable territories. Unlike a simple circle drawn around a point, an accurate catchment area follows how people actually travel across roads, rivers, and terrain. You can read a fuller explanation in this guide to catchment areas and the GIS tools behind them.
How do you create a catchment area map from a list of facilities?
You create a catchment area map by taking the coordinates of each facility and assigning every surrounding area to the site that people can reach fastest, usually by shortest walking time. Rather than drawing fixed-radius circles, the calculation accounts for roads, rivers, elevation, and land cover, so boundaries reflect real travel instead of straight-line distance. This is the standard "site-based" approach, and this walkthrough covers creating catchment maps from GPS coordinates step by step. Tools like the free Crosscut App generate these maps in minutes without a GIS background.
Why not just draw a circle around each facility to show its coverage?
A circle assumes people travel in straight lines at a constant speed, which is rarely true. Radius circles ignore the rivers that force detours, the mountains that slow travel, and the roads that speed it up, so they overstate coverage in hard-to-reach areas and understate it along good roads. Travel-time catchment areas instead measure how far people can actually get on foot or by vehicle, which produces boundaries that stretch along highways and stop at unbridged rivers. For campaign planning, that difference determines whether a community is correctly counted as covered or missed.
How do you divide a district into equal workloads for health teams?
You divide a district into fair team territories using a clustering approach that balances population, buildings, or total workload rather than land area. A population-based split gives each team roughly the same number of people, while a workload-based split accounts for travel time, so a sparse rural team covers fewer people than a dense urban one for the same day's effort. This is central to door-to-door campaigns like mass drug administration or vaccination, where uneven territories leave some teams overloaded and others idle. The goal is territories teams can realistically cover given the local terrain and population.
Do you need GIS software or a specialist to make catchment area maps?
No. Traditional catchment mapping required GIS specialists running computer-intensive models in software like QGIS or ArcGIS, or local teams marking boundaries on paper maps by hand, both of which are slow and expensive. Web-based tools have since made it possible to upload a list of sites and generate travel-time catchment areas in minutes, with the road, elevation, and population data already loaded. Program managers and ministry staff can now produce and edit these maps themselves without a GIS background.
Related Posts
What WHO's immunization campaign guide says about catchment area maps

Madagascar's schisto MDA: Getting 19 district microplans into one place

What WHO's NTD microplanning manual says about operational maps
