
July updates: KoboCollect support and better performance in large countries

Most of what we worked on over the past two months came from watching the tool get used in real campaigns, in bigger and more difficult geographies. Some of it is new capability, like support for another field data collection tool. Other updates are focused on making the Crosscut App hold up when the country is large, the population is sparse, and the connection is slow.
Here's what’s new, and what we’ve been working on over the last month.
KoboCollect integration: daily supervision maps from a third field data tool
Field supervision teams collect their daily site-visit data in mobile data collection tools. We can already pull that data automatically from CommCare and ODK to build supervision coverage maps that refresh every day, which is the same approach behind our supervision gap work with The Carter Center in Nigeria. As of this month, the platform also supports sKoboCollect (part of KoboToolbox), a third widely used option for collecting data in the field.
The way it works is the same as the other two. The platform reaches out to the activity’s Kobo instance once a day, pulls the latest supervision visits, and rebuilds the catchment map at a stable link you can bookmark. Program managers open the same URL each morning and see where supervision visits have happened, without anyone re-uploading anything by hand. During a mass drug administration (MDA) campaign, that gives you a near real-time picture of coverage as it builds.
So the Crosscut App now works with all three of these major mobile data collection tools field health programs use. Whichever option your program already has in place or is familiar with, the daily supervision map works the same way.
Downloadable administrative boundaries with source information
Every catchment map the Crosscut platform builds uses a set of administrative boundaries as a foundation. These are the regions, districts, wards, and so on that define how a country is organized for geospatial microplanning campaigns. You can now download that full set for your country directly from the map sidebar as a single GeoJSON file.
We heard from partners that often need the exact same boundary files we use for their own GIS work and their own reports. Rather than rebuilding them or hunting them down elsewhere, they can pull them straight from their Crosscut project. Alongside the download, there's an info panel showing where the boundary data came from and how current it is, so anyone using the file knows exactly what they're working with.
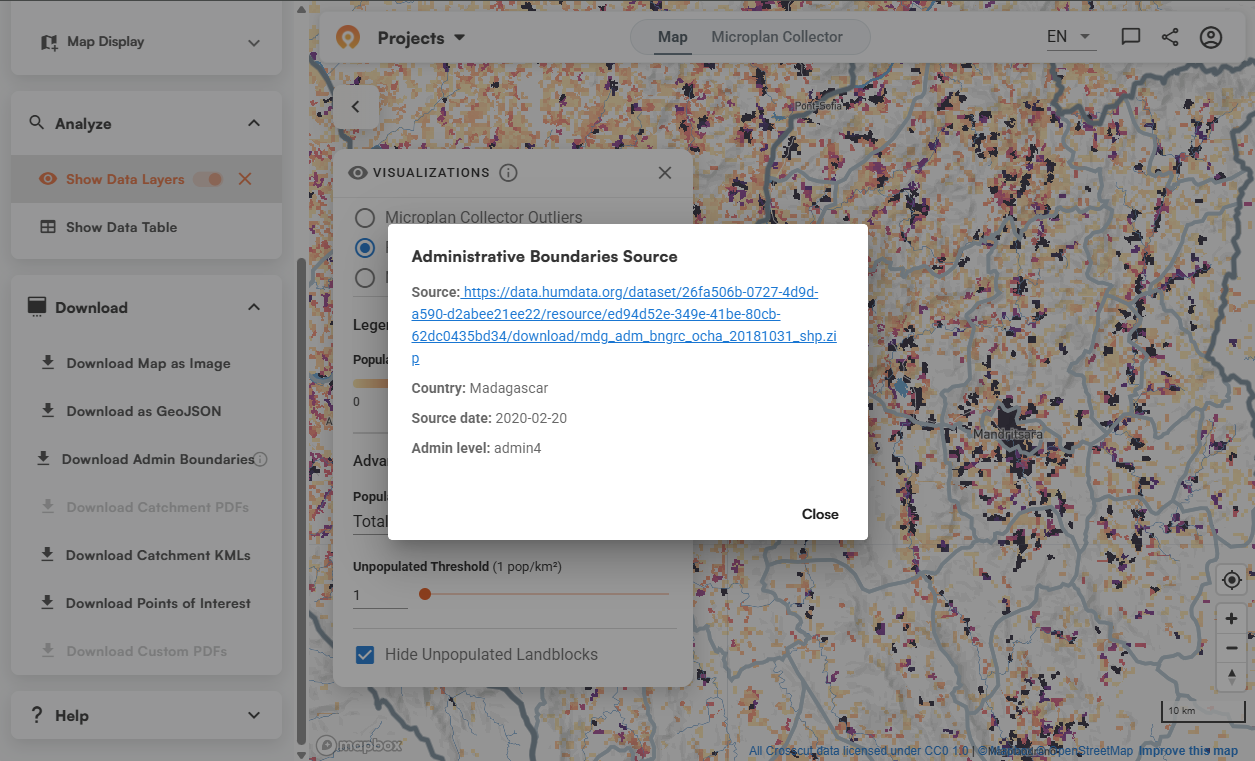
Making our data easy to reuse is something we care about. The settlement catchments we publish on the Humanitarian Data Exchange include the same kind of source information, so other teams know where the data came from and how current it is.
Better performance in large countries, including DRC
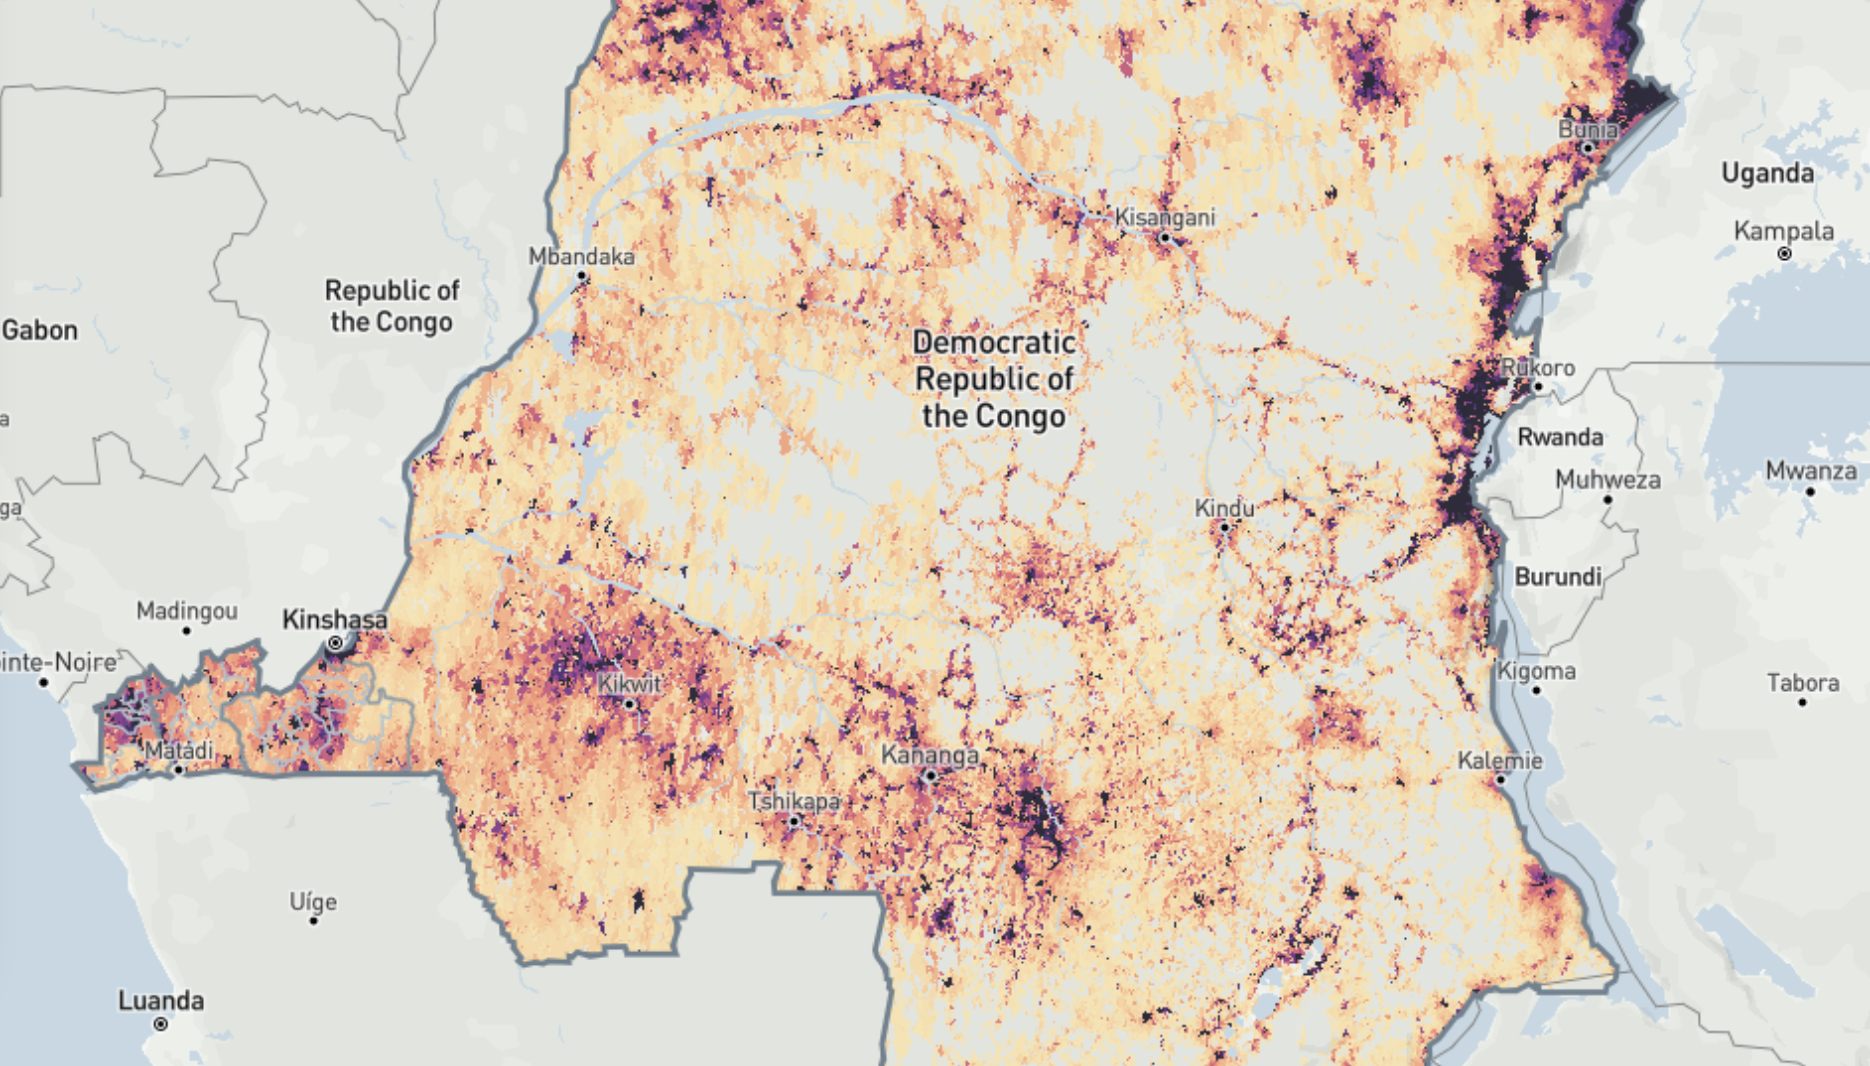
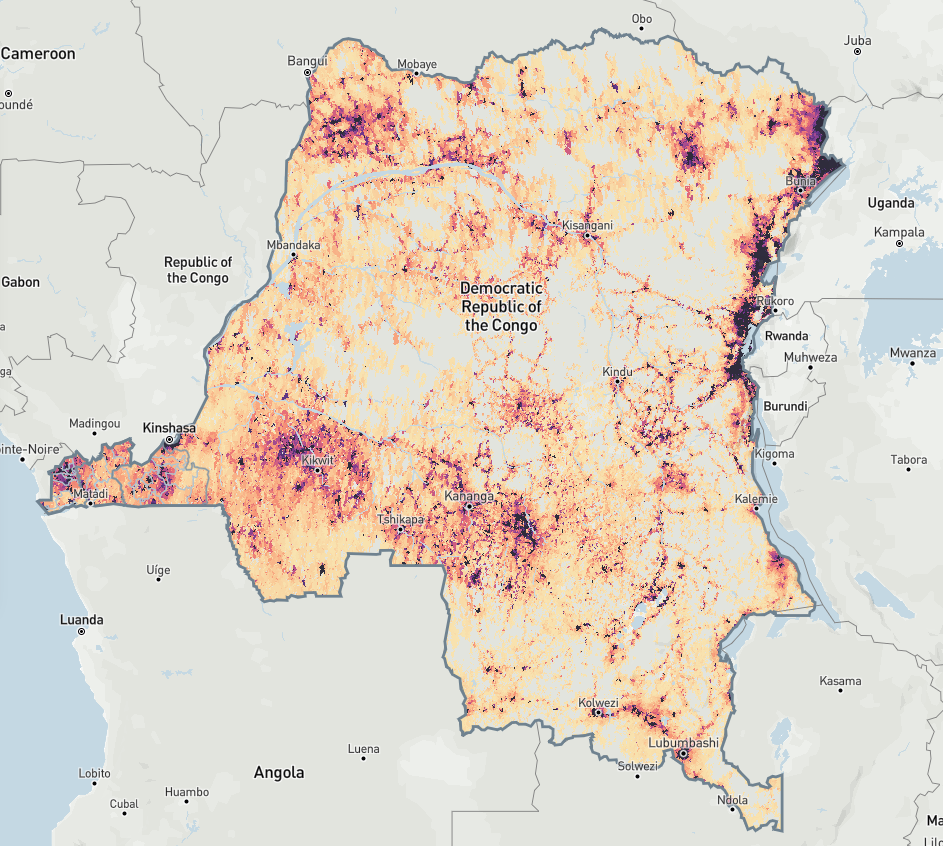
The Democratic Republic of the Congo was a big focus these two months. It’s a country with a lot of technical challenges because it's very large, with wide stretches where the population is thin and the data is sparse. Those conditions break assumptions that hold up fine in smaller, denser countries, and working through them took up a good part of the past month.
The biggest change was speed. Downloading the nationwide geographic input files was the slowest part of generating catchment area maps for a country DRC's size. We now split those files by administrative subdivision and download them in parallel before merging them, so a planner working on one part of the country no longer waits on the whole thing to load.
A few other fixes came out of the same sprints:
- Province-by-province planning. We added dropdowns for Haut-Katanga, Kongo Central, and Sankuru, so a team can run the work one province at a time. Restricting a catchment to a single province used to trigger a long timeout because the app still pulled every administrative name in the country. Now it requests only the province you're working in.
- Population density that displays in near-empty regions. The visualization rendered blank where nearly all the land is uninhabited, which describes much of rural DRC. It shows up correctly now.
- A Microplan Collector that loads on slow networks. The Microplan Collector kept failing to load over weaker internet connections. We added retries and longer timeouts when it fetches boundary data, so it loads better now with spotty connections.
This builds on work we've already been doing in the country. When our partners at Unlimit Health ran a schistosomiasis survey in DRC, no usable boundaries existed, so thy built the health catchments themselves from GPS points and hand-drawn maps from local officials. These fixes are meant to take more of that burden off teams working where the data is thinnest.
More reliable shareable map links
The Crosscut App can now share a preconfigured map link that opens with specific settings already applied. Pre-set variables include things like the zoom area, population filters, and which points of interest are visible. We use these often to send a ready-to-read view, including the daily supervision maps above, so the link has to open exactly the way we built it.
We expanded how much information these links could transmit earlier this year, and this month we made those settings hold more reliably:
- High and low population density filters now travel with the link.
- The map view we set no longer gets overridden by the Crosscut App's automatic jump-to-catchment behavior.
- Settings that once loaded unreliably depending on the map's load speed now apply every time.
This sharing option is separate from the Microplan Collector project sharing we added in May. That feature lets users share a project and set expiration dates yourself. These preconfigured map links are something we build and send directly to clients during a campaign or training.
Smaller fixes that save time for everyday use
The remaining updates cover the small tasks planning teams will need to repeat frequently, where shaving a few seconds off repeat jobs adds up over a campaign:
- A progress bar for catchment jobs. Creating catchments for a whole region can take several minutes. Until now, Crosscut showed a generic spinner, with no way to tell whether the job was progressing or stuck. There's now a progress bar with an estimated countdown, so you know the job is healthy and roughly how much longer it will take.
- Cleaner email intake for the Microplan Collector. The Microplan Collector receives completed microplans by email, and it was treating logos and signature images in email footers as if they were data. This triggered false "invalid file type" errors. The app now only processes the actual spreadsheets, so coordinators emailing from ordinary email clients stop getting those false failure notices.
- Cleaner catchment naming. Catchment names now come out the way you'd expect. A unique name loses the unnecessary "#1" suffix it used to carry, and catchments that share a name are numbered in order instead of with random gaps, so "Kogi #3" and "Kogi #5" read as "Kogi #1" and "Kogi #2." It means less confusion and manual data cleanup when you export or print a plan for field teams.
What's up next for the Crosscut App
We'll keep working along the same lines, making the platform faster and more dependable in the places where planning is hardest and connections are least reliable. Fitting into the tools and technology programs already run is the other half of the job, which is what the KoboCollect work was about this month. It's the same reason we're a DHIS2 technology partner, and what Coite spoke about at the DHIS2 annual conference in Oslo this June.
All of these updates are available now in the Crosscut App at no cost. If your program uses CommCare, ODK, or now KoboCollect and wants automated supervision maps set up for a campaign, You can also reach us directly through our contact page.
Related Posts
What WHO's immunization campaign guide says about catchment area maps

Madagascar's schisto MDA: Getting 19 district microplans into one place

What WHO's NTD microplanning manual says about operational maps
