
What UNICEF and Gavi learned about real-time campaign monitoring for health campaigns


Health campaign data usually tells program supervisors what already happened more than what they can still fix in real time. Finding ways for health practitioners to shorten this reporting gap and how these information systems are created was a main focus at this year’s ESPEN’s annual meeting in Lilongwe, at WHO’s Brazzaville workshop, and at the DHIS2 conference in Oslo.
Historically, health programs develop and work within their own reporting systems, and those systems rarely talk to the systems of other programs within the same ministry. Teams reuse datasets and tools between campaigns, but pulling everything together from the previous campaign takes significant manual effort. Ministries of health and partners are pushing back on that obstacle by standardizing data collection on platforms they already run, like DHIS2, and by publishing open data through platforms like the Humanitarian Data Exchange (HDX).
A UNICEF and Gavi review, The Use of Digital Technologies and Approaches for Real-Time Monitoring of Supplementary Immunization Activities, covers what happens inside campaigns when data doesn't connect. The review mostly covers immunization, but lessons apply to any campaign that needs same-day data, including mass drug administration (MDA) campaigns.
What counts as real-time monitoring for health campaigns
Real-time monitoring (RTM) means teams use digital tools to share and use health campaign data the same day it's collected. For example, RTM would mean a supervisor who learns on Tuesday that a team missed its target can redirect the team on Wednesday.
The UNICEF/Gavi guidance covers case studies in Pakistan, Indonesia, Uganda, and Zambia, plus published evidence from seven more countries related to how health campaigns have utilized RTM. The repeats two core lessons throughout the document. They suggest:
- Keeping the number of platforms, forms, and manual data processing to a minimum.
- To prioritize same-day monitoring elements when selecting tools.
How Pakistan built same-day reporting out of WhatsApp
Pakistan's 2018 measles campaign reached 37 million children, and its 2019 typhoid campaign in Sindh province reached 9.5 million. Both campaigns used official reporting tools, KoBo Toolbox and RapidPro, and both ran into the same problem. Data had to be cleaned and approved at the central level before field teams could see it, and the KoBo Toolbox dashboard only displayed national numbers with no way to drill down to a district.
The program built their own same-day real-time reporting system out of WhatsApp. They posted structured coverage reports into campaign groups, dedicated monitoring cells watched the incoming messages, and staff escalated problems the day they appeared.
- Structured daily coverage reports, posted team by team with targets and achievements
- Photos and other evidence the RapidPro application couldn't transmit
- Qualitative issue reports that didn't fit the official checklists, like a vaccinator denied supplies at a distribution point
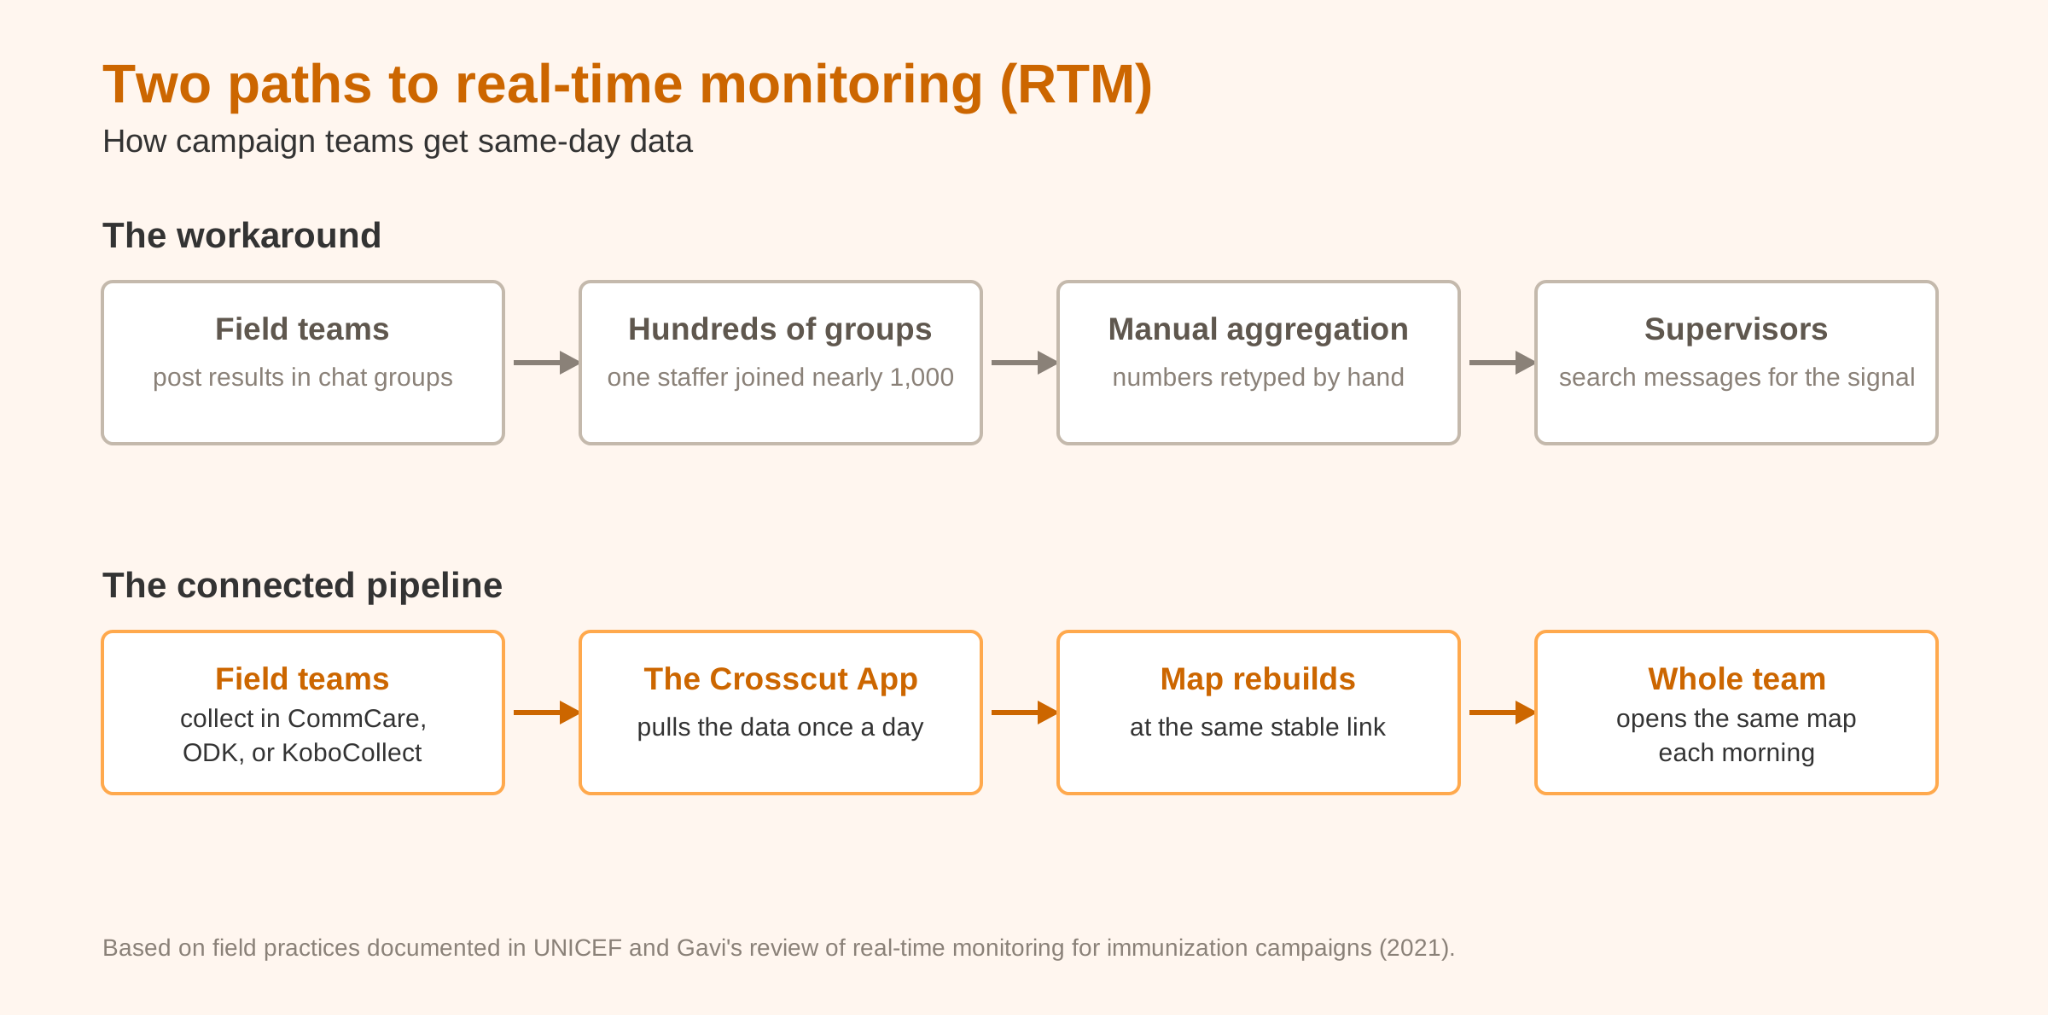
The workaround was effective but manually done and time-consuming. Staff aggregated every number posted in a chat by hand, and supervisors described a large amount of messages. One staff member in Karachi was subscribed to nearly 1,000 WhatsApp groups for the campaign, and said he would have missed the critical issues without designated focal points helping him, the staff in the groups flagging errors to him.
While time-consuming, the workflow worked as intended. Field teams said the issues they flagged issues and supervisors were able to correct the same day. The two systems also reinforced and cross-checked each other. KoBo Toolbox data arrived late, but supervisors used it to validate the numbers from WhatsApp. When UNICEF and Gavi tell programs to manual processing and prioritize same-day data, Pakistan is the experience it's describing.
Keeping the data collection tools teams already use
Most campaigns already have their data workflows. Field teams log supervision visits in mobile tools like CommCare, ODK, or KoboCollect, and population data moves by email and Excel. UNICEF and Gavi's advice is to build on the workflows in place rather than hand field teams something new in the middle of a campaign.
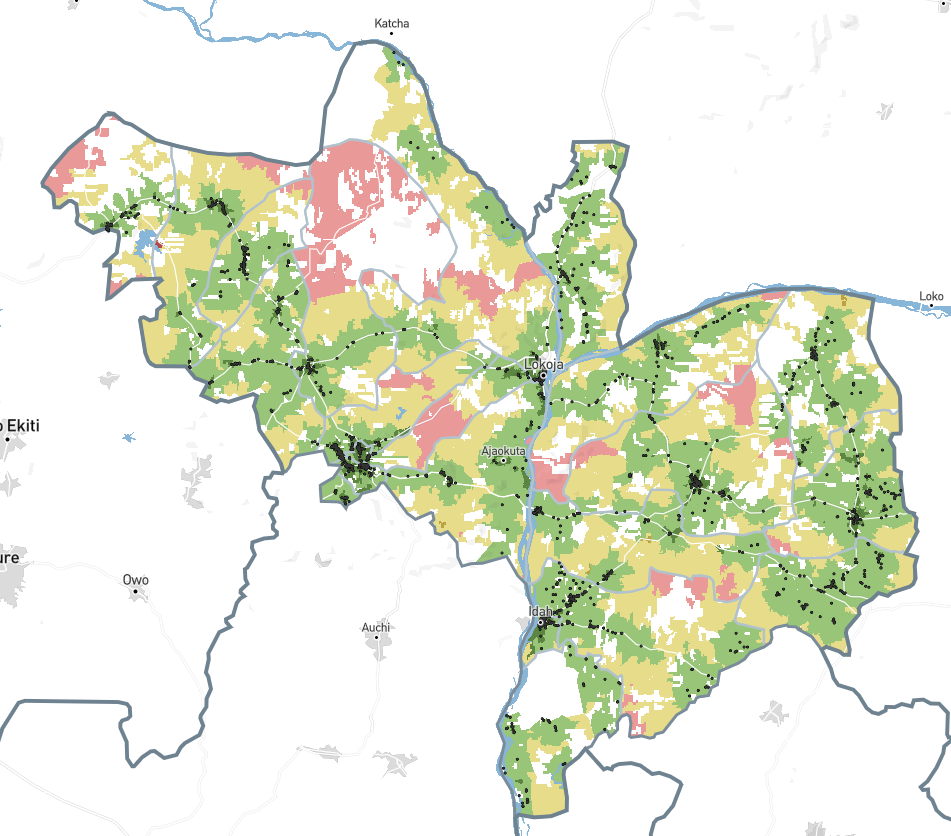
The Crosscut App connects to both workflows. For supervision data, it pulls the visits field teams log in CommCare, ODK, and KoboCollect once a day and rebuilds a coverage map at a stable link. A program manager opens the same URL each morning instead of scrolling chat groups in WhatsApp. KoboCollect is what Pakistan's campaigns reported through. For population data, the Microplan Collector sends the Excel templates by email, validates each file as it comes back, and aggregates the submissions into one dashboard.
Health programs across sub-Saharan Africa already use these daily supervision maps in live campaigns. In Nigeria, teams working with The Carter Center used the daily supervision maps to find the communities their supervisors were missing while the campaign was underway. In Guinea-Bissau, teams analyzed the previous year’s supervision data to build balanced supervisory areas and printed maps before MDA started.
What UNICEF and Gavi say about catchment maps and geospatial microplanning
The Pakistan program cross-checked data from WhatsApp against other data from KoBo Toolbox. The team also checked its microplans before the campaign started, with supervisors using KoBo Toolbox to track the desk review and field validation of each one. In Nigeria, the team ran that kind of check during the campaign itself.
The planning team in the Nigeria case study compared the routes vaccinators actually walked, recorded by GPS, against the hand-drawn microplan maps that were supposed to guide them. The comparison showed them problems that would have been hard to catch any other way. Distances between landmarks did not match up, the routes lacked enough detail to follow, and vaccinators regularly had to improvise. Planners then used the same GPS data to correct and validate the microplans for the following campaigns.
The Zambia case study provides an example of what these microplan maps often look like in the field. The hand-drawn zone map below records household counts, target population, and doses in its corner notes, along with an estimated 20% margin of error.
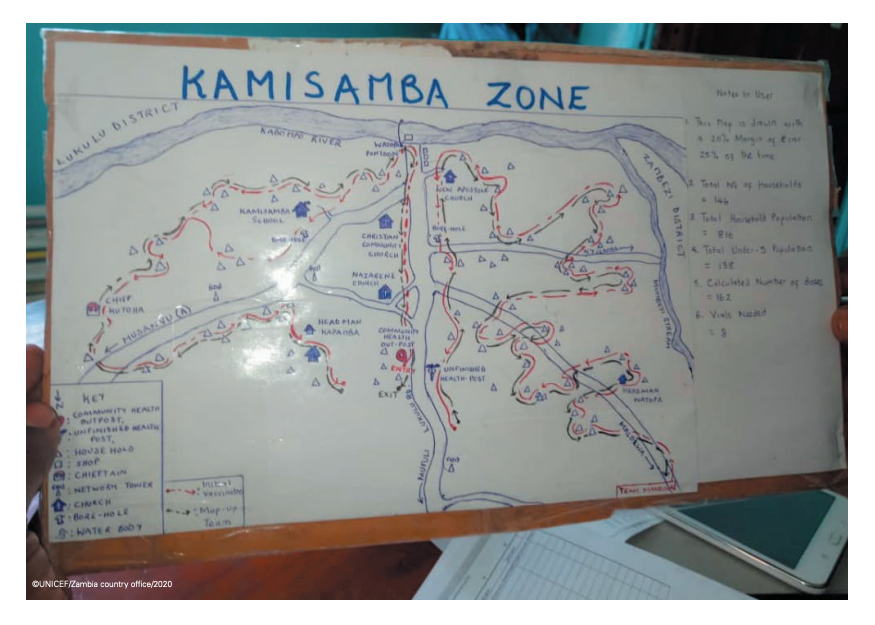
Hand-drawn maps like these hold valuable local knowledge, and teams should use that information when they build new operational maps. The challenge is keeping that knowledge without carrying inaccuracies into the next campaign, like the unreliable routes Nigeria found and the margin of error Zambia wrote on the map itself.
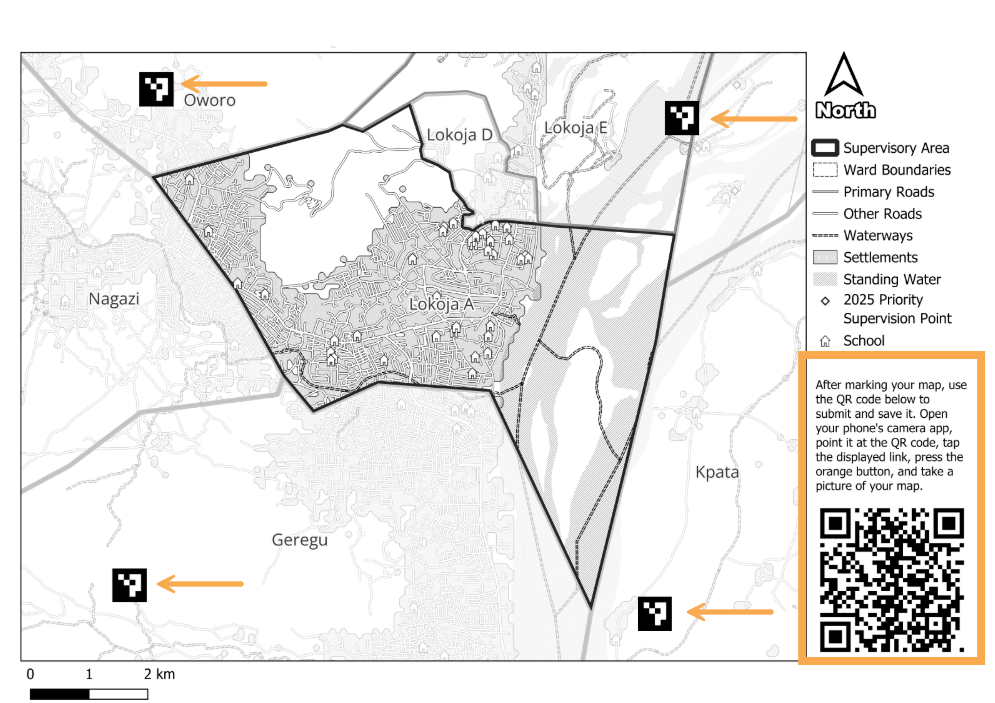
Take the Zambia map above. In the Crosscut App, the catchment map would start from the program’s own facility and community lists, with measured distances and a population estimate in place of the 20% margin of error. Local knowledge still goes onto the map the same way. Supervisors can print the maps to mark up in training sessions and carry into the field, and redraw boundaries by hand wherever they know the area better than the data does.
Getting campaign data where every program can see it
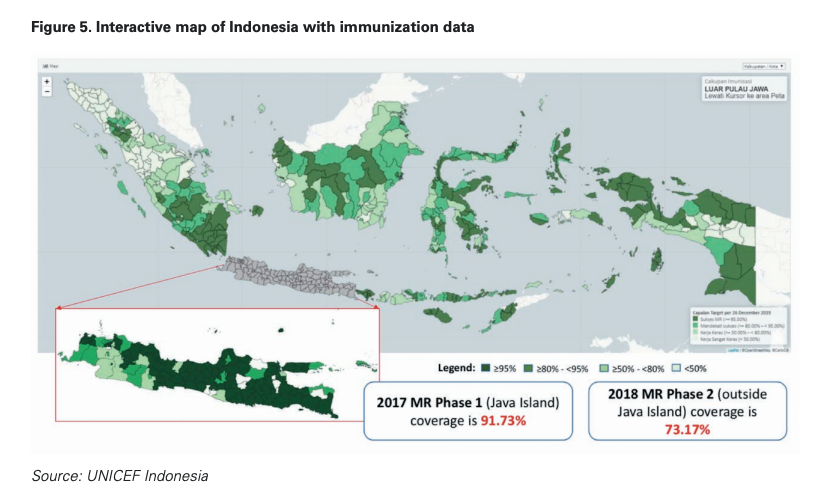
The final case studies come from Indonesia and Uganda. The guidance points out that both programs put campaign data in one place where everyone could see it. Indonesia tracked a 68-million-child measles-rubella campaign on the interactive coverage map below. Every level of the program watched the same map instead of waiting for reports to move up the chain. Uganda connected ODK data into DHIS2 dashboards, and supervisors corrected problems faster because the data appeared in a system they already used.
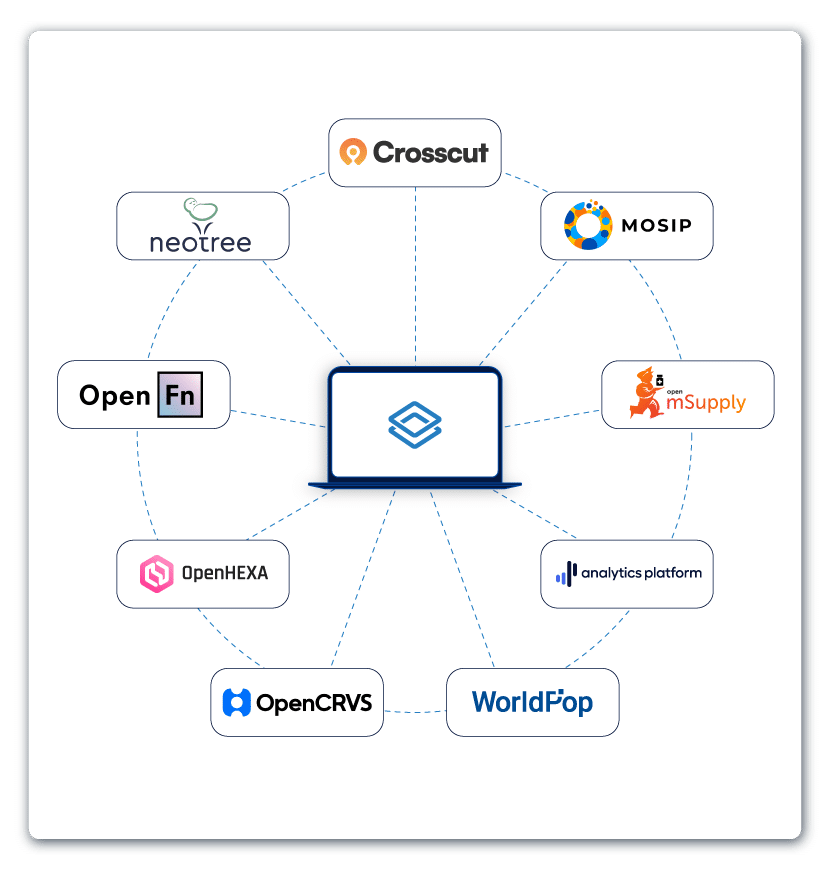
DHIS2 is the world’s largest Health Management Information System (HMIS) platform, and most ministries of health in sub-Saharan Africa already manage their routine health data in it. The Crosscut App publishes catchment maps directly into DHIS2. We’ve also deepened the integration as a DHIS2 Strategic Technology Partner, so a map built for one campaign is available to every program planning in the same system.
Finally, UNICEF and Gavi also note that monitoring investments in Haiti and Nigeria produced registries and validated maps that other programs later reused – what the authors call public goods. We publish our catchment data openly through HDX for the same reason. A program planning its next campaign can start from maps that already exist instead of drawing new ones.
A free catchment mapping and monitoring system for national health programs
UNICEF and Gavi's review came out five years ago, and national health programs across Africa are still looking for ways to enact those suggestions. In Lilongwe, Brazzaville, and Oslo, teams told us they want campaign data the same day, fewer platforms and less manual work, and maps and data they can reuse in the next campaign.
The Crosscut App is a free, web-based catchment area mapping platform:
- Build daily supervision maps from the data teams already collect in CommCare, ODK, or KoboCollect.
- Collect population data with the Microplan Collector, a white-label version of the Crosscut App. Teams keep working in email and Excel, and the tool validates and aggregates everything. WHO offers it through the ESPEN Geospatial Microplanner.
- And the Crosscut App publishes the finished catchment maps into DHIS2, where the next campaign can open them.
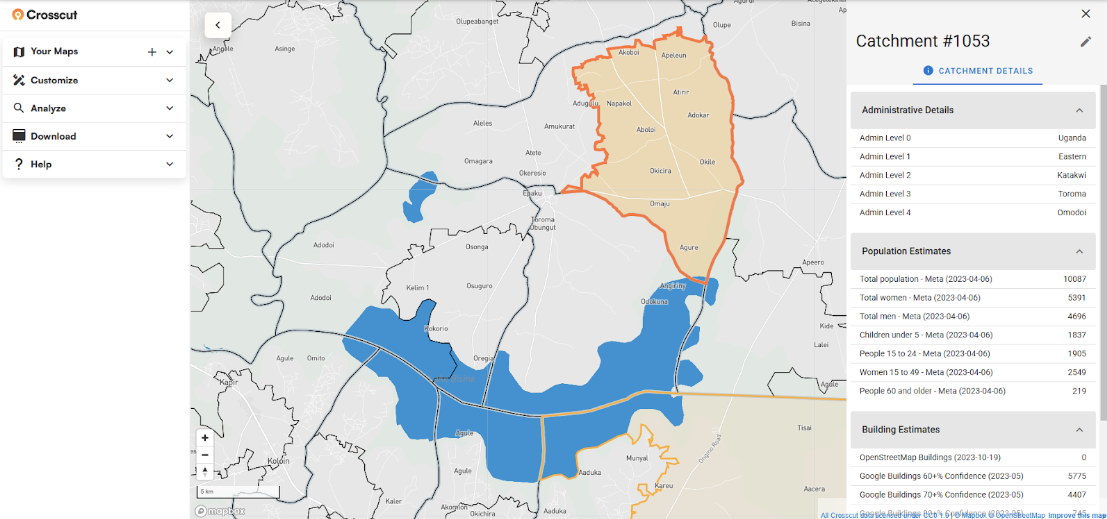
If your program wants a daily supervision map set up for a campaign, the Crosscut App is free to use. For program-level monitoring setups, reach out to us or check out our advisory services.
Frequently asked questions
What is real-time monitoring in health campaigns?
Real-time monitoring means using digital tools to share and use campaign data the same day it's collected, so supervisors can correct problems like missed communities or supply gaps while the campaign is still running. UNICEF and Gavi documented how four countries used real-time monitoring in a 2021 review of immunization campaigns.
What tools do health campaigns use for real-time monitoring?
The review's case studies used KoBo Toolbox, RapidPro, ODK, and DHIS2 dashboards, alongside informal WhatsApp reporting. Most programs pair a mobile data collection tool for field teams with a dashboard or map that supervisors watch.
Does the Crosscut App work with KoboToolbox, CommCare, or ODK?
Yes. The Crosscut App pulls supervision data daily from CommCare, ODK, and KoboCollect (part of KoboToolbox) and rebuilds a catchment-based coverage map at a stable link. Field teams keep collecting in the tool they already use.
How do supervision maps work during a campaign?
The Crosscut App reaches out to the program's data collection platform once a day, pulls the latest visits, and updates a map showing which communities have been covered and which haven't. Program managers open the same link each morning, the way teams in Kogi State did across an NTD campaign.
How do health programs validate microplans?
The review describes desk reviews, field validation, and comparing GPS tracks against planned routes. Generating catchment maps from the program's own community lists gives validators real geography to check against, and printable catchment maps carry the validated plan into field meetings.
Can campaign data be shared across health programs?
Yes, and the review found that monitoring investments often become public goods other programs reuse. Publishing catchment maps into DHIS2 puts the maps where every program planning in the system can use them, and openly licensed catchment data on HDX extends the same maps beyond any single organization.
Related Posts
What are never treated communities, and how does WHO’s new toolkit help NTD programs find them?

What GPEI's polio outbreak guidance says about catchment area maps
What WHO's routine immunization guide says about catchment area maps
