
What WHO's indoor residual spraying manual says about catchment area maps

.png)
Indoor residual spraying works when teams spray the inside walls of the houses where mosquitoes rest. These campaigns falter when teams cannot find those houses, or figure out how many houses are in an area. The World Health Organization’s (WHO) Operational Manual on Indoor Residual Spraying calls that work “geographical reconnaissance.” Teams map the target area and count every structure inside it before the campaign starts.
The manual sets out that spraying guidance for five groups of vector-borne disease:
- Malaria
- Aedes-borne diseases (e.g. dengue, chikungunya, and Zika virus disease)
- Chagas disease
- Leishmaniases
- Lymphatic filariasis
This article goes deeper into indoor residual spraying (IRS) campaigns section of the microplanning guides. Everything below comes from WHO’s manual itself, so you can see which catchment maps your program will benefit from having before spraying begins.
Geographical reconnaissance comes first
Geographical reconnaissance is a long-standing approach in vector control. WHO’s manual defines it as censuses and mapping that establish where people live, where the houses sit in that area, and what else in the local terrain shapes disease transmission. Planning teams generally walk the target area before the campaign, record the structures, and assign each one a unique number that follows it through the spray round.
Programs try to run reconnaissance before the first spray round. When money or time rules that out, the manual suggests reconnaissance during the first round. You can refresh it in later rounds as the campaign goes on. Either way the data has a shelf life, so the manual says to timestamp every layer and record where it came from so years don’t run into each other.
You should also check what data already exists first. The manual points to statistics offices, agriculture ministries, public works, and local NGOs, all of which hold GIS work worth building on. Even when these datasets exist, they usually require a degree of cleaning and processing. For example, it’s pretty common for some villages to carry a different spelling in each file until you match the names across datasets.
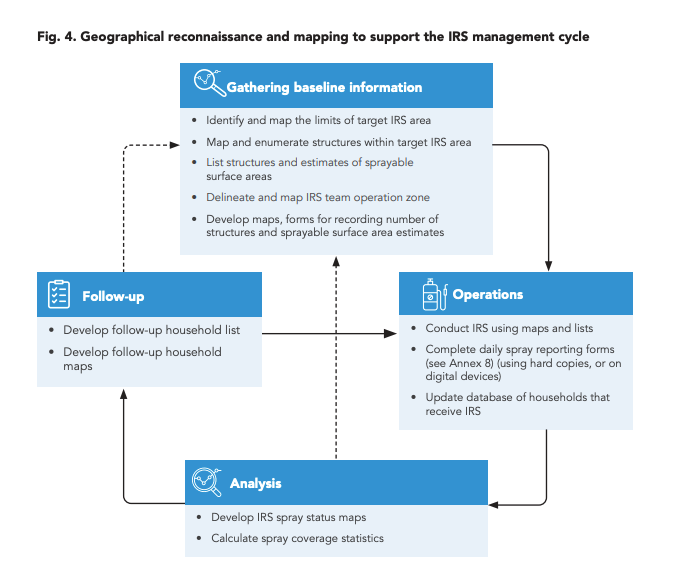
What the manual asks the maps to show
Figure 4 in the manual lists the baseline products a program needs before operations begin:
- The limits of the target area. Usually administrative boundaries, though some campaigns target a cluster of cases instead of a district. The Crosscut App has boundaries loaded for every Sub-Saharan African country, down to the lowest level a country publishes.
- Every structure inside those limits, mapped and counted. The manual favors doing this on a GPS-enabled phone or tablet, georeferencing each household, attaching the census questions to that location, and issuing the building's unique number on the spot. If a program already collects that data in CommCare, ODK, or KoboCollect, Crosscut pulls it in and builds the spray maps from it directly.
- A list of structures with estimated sprayable surface area. Programs measure sprayable surface in a sample of 5 to 10 percent of households, classify structures as traditional or modern, and multiply out across the target area. The manual asks for the figure before procurement, which puts mapping upstream of the supply chain. We built an IRS supply planning module into the Crosscut App for exactly this calculation. It measures building sizes from satellite imagery for each operational site and turns them into quantities of insecticide, supplies, and staff.
- An operation zone for each spray team. The manual sets requirements rather than a method. Every village has to be covered, no team gets an unmanageably large area, and operators must never be so scattered that supervision and resupply break down. Meeting all three is what the catchment algorithms do in the Crosscut App.
- Recording forms for the counts and the surface estimates.
Drawing operational zones raises a second question: where does each team work from? Field camps are temporary sites near the spraying that hold a team's insecticide and equipment, and programs set them up when the fieldwork sits too far from the district store for teams to return each day. A camp needs road access for resupply, water nearby for cleaning tanks, and no sensitive land downhill, since the rinse water carries insecticide. Putting roads, water points, and protected areas on the same map as the structures is how a program finds sites that meet all three requirements.
How far apart the structures sit also determines staffing requirements. One spray operator usually sprays 8 to 10 structures a day where houses cluster, as many as 15 in some locations, and as few as five where structures spread out across long walking distances. Crosscut can be used to classify areas based on how close together buildings are and establish different spray operator zones based on whether they are covering 8-10 structures per day or 15 per day.
Structure counts determine the campaign scope and budget
A program budgets against the structure count. That figure determines how many spray operators get hired and how much insecticide gets ordered, and the manual wants both numbers before the round starts.
For staffing, the manual suggests dividing the structures to be sprayed by the number one operator handles per day, then divide again by the length of the campaign. That daily figure changes with the terrain. One operator usually sprays 8 to 10 structures a day where houses cluster, as many as 15 in some locations, and as few as five where structures spread out across long walking distances. An identical count can mean two very different campaigns.
Insecticide comes off the surface estimate, and the manual asks for the figure before procurement. We built an IRS supply planning module into the Crosscut App for the same calculation, measuring building sizes from satellite imagery for each operational site and turning them into quantities of insecticide, supplies, and staff.
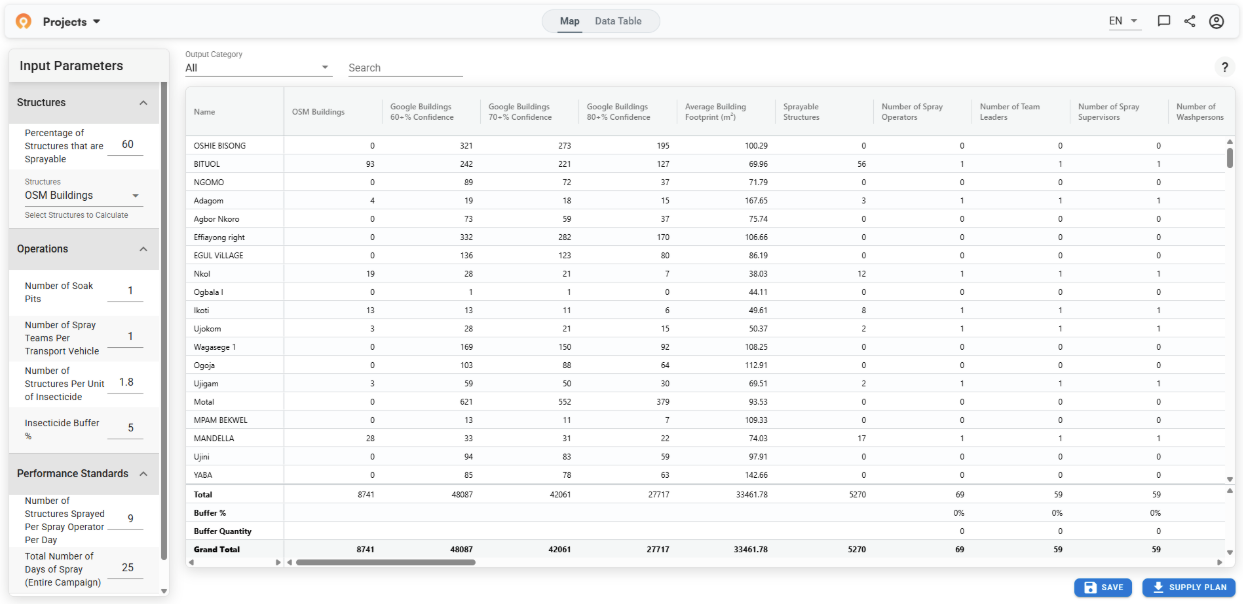
Both numbers depend on counting the right structures, and a sprayable structure is not simply any building. Structures that fall outside the line still need recording, either in the number painted on the door or on the house spray card, and spray coverage later gets measured against the structures the reconnaissance found.
From paper sketches to GIS catchment area maps
The manual suggests a wide range of tools for spraying campaigns. Topographical maps from the surveyor general's office are useful. Satellite imagery from open-source options like Google Earth and OpenStreetMap are another good option. Handheld devices with GPS that georeferences each household in the field also come up frequently.
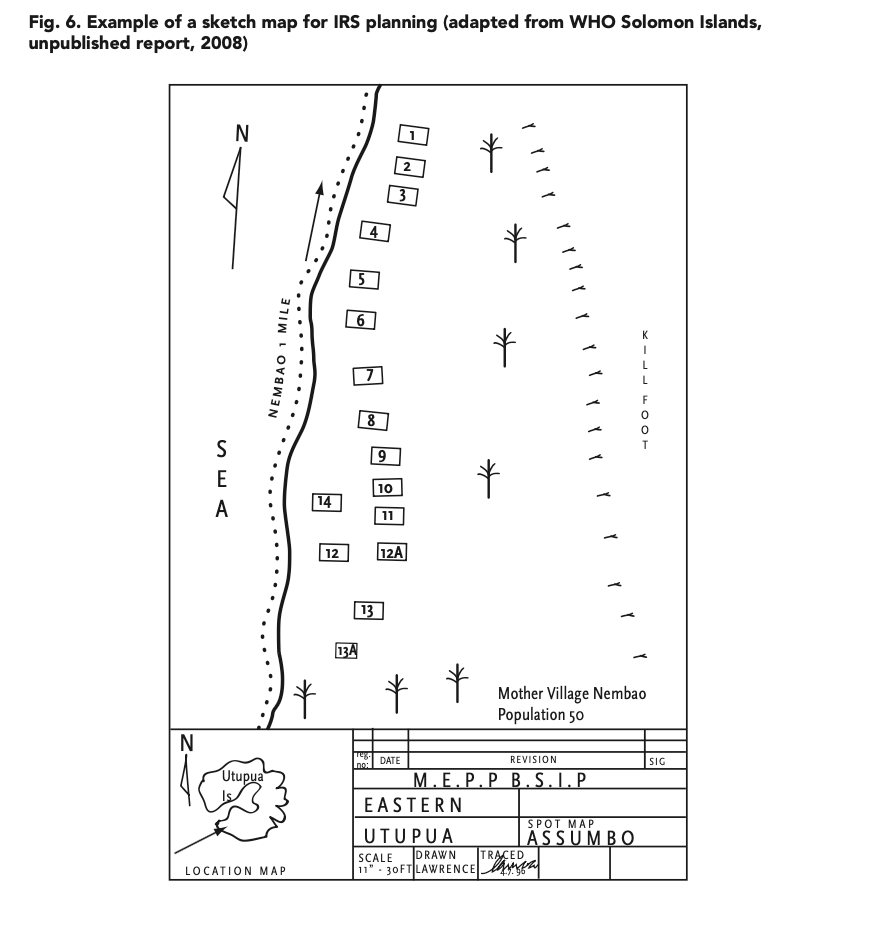
Many field teams draw the maps by hand. The campaigns mark the houses to spray and the routes between them on a sketch map with a compass, then pick the field camp location off the same sheet. A hand-drawn map can meet the standard as long as it covers what the manual suggests and gives teams an accurate account of current conditions and coverage in the area. The Crosscut App exports printable maps for the same purpose, so a team can carry the structures and boundaries on paper without drawing them first.
A hand-drawn sketch map for IRS planning: fourteen numbered houses, one village, 50 people.
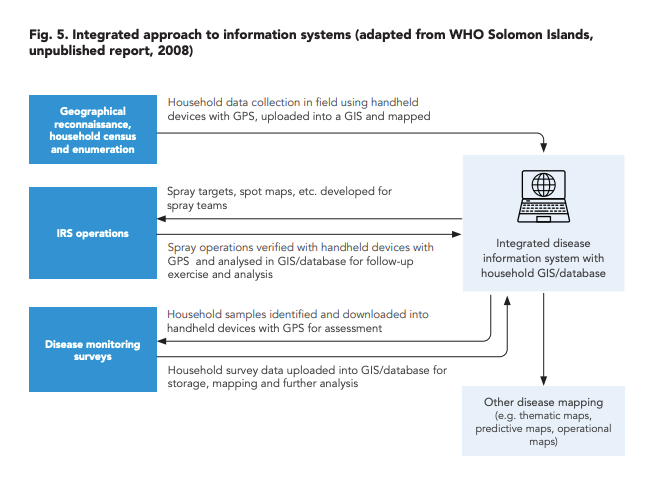
The manual points programs toward an integrated system where reconnaissance data, spray operations, and disease monitoring surveys all tie to the same household database. A campaign generates records faster than paper can hold them, and a sketch map cannot tell a manager how much of the district is covered halfway through the spraying rounds. Keeping the maps and the spray records together, in a digital tool like the Crosscut App, makes it easier to answer those questions.
Where the Crosscut App fits into IRS campaigns
Reconnaissance is expensive. Getting more out of every spray operator and every liter of insecticide comes back to teams learning as much as they can about the area before the round starts. When funding or timing rules out the full pre-campaign exercise, you can map the area during the first round and refresh the data later.
Every program should check the GIS work other agencies already hold before sending anyone out. Most of what Figure 4 asks for above, the boundaries, the structure count, and the team zones, can come together in one dashboard without leaving the office.
The Crosscut App works from those same open sources. It draws the limits of a target area, counts the buildings inside it from OpenStreetMap, Overture, and Google footprints, then splits the ground into team zones. Equal building counts are not equal work, which the manual says outright when it drops an operator's day from 10 structures to five in scattered terrain.
Start: Every structure in a target area
A spray campaign needs a count of every building. Teams normally produce that by walking the area and recording each structure one at a time, since population figures count people rather than houses. Building footprints give a program the starting number, 1,201 here, before anyone goes out.
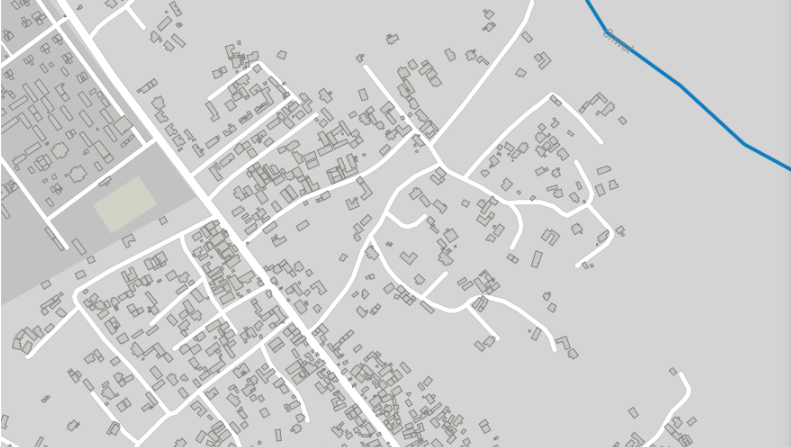
Finish: Same area with building footprints across a target area.
The total tells a program how much insecticide to order and how many spray operators to hire. Dividing it up is a separate job, and the zones have to hold roughly equal workloads or some teams finish early while others fall behind. Zone 1 covers 388 structures, Zone 2 covers 412, and Zone 3 covers 401.
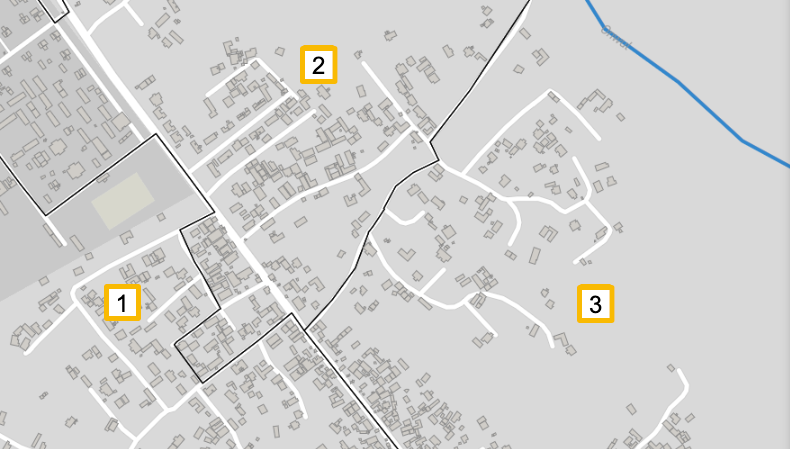
The Crosscut App’s Fair supervisory areas balance zones on travel time and barriers rather than on count alone. Travel time layers show the same picture across the whole target area as a heat map, marking which areas are furthest away from a road.
What the manual asks for, and where it comes from
Helping teams identify structures for IRS with less legwork
Many districts hold tens of thousands of buildings. For malaria campaigns, operators spray the walls, ceilings, and eaves throughout a house. They leave out the kitchen, and any room where someone sick or elderly cannot be moved. Metal surfaces like a tin roof get skipped, because insecticide runs off without leaving a residue. Every building needs the same three checks: what it is used for, what it is made of, and who is inside.
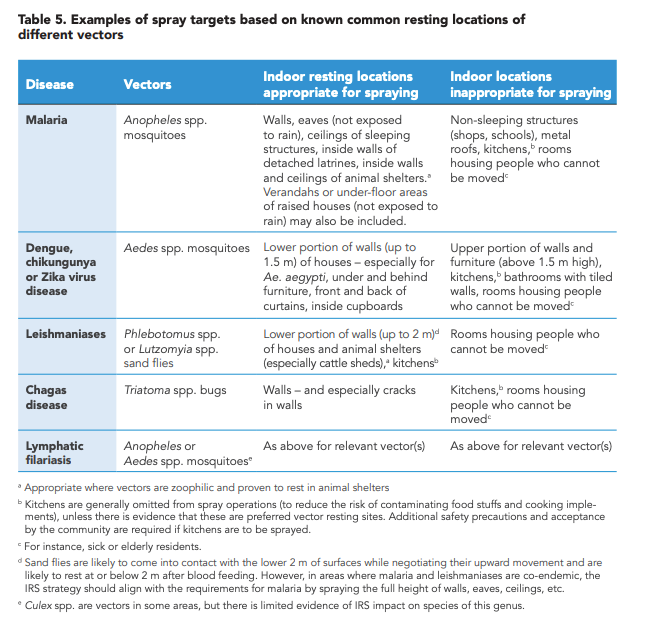
For Aedes-borne diseases, only the lower 1.5 meters of a wall qualifies, and insecticide above that line costs money without stopping transmission. A malaria program may also add a school or a health center where local conditions call for it. Knowing all these rules is one thing. Applying them to every building in a district is harder, because the map shows you where the buildings are without telling you what they are. The most reliable way is to visit each structure, which takes time and money most programs do not have. Whoever is buying the insecticide needs quantities months before the round starts, and those quantities come from the structure count, so the count cannot wait for a full survey to finish.
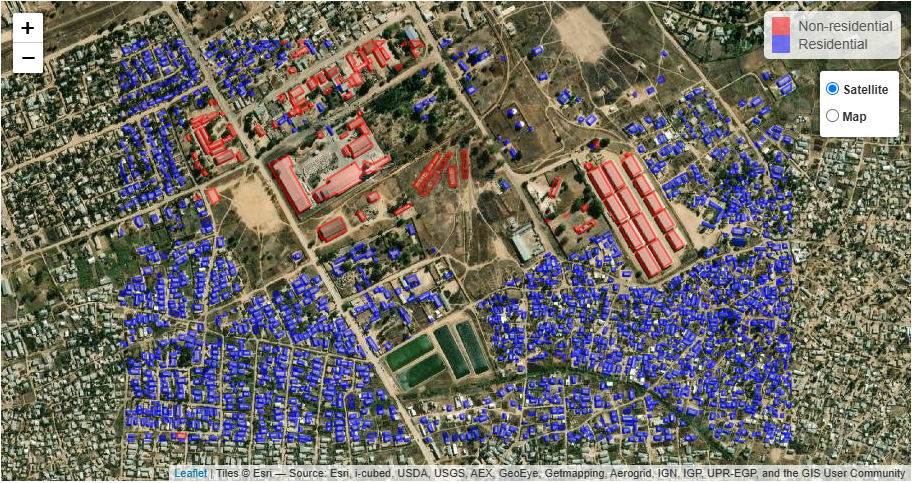
On the PMI Evolve project managed by Abt Global, we partnered with Loamin to help tell the two kinds of building apart without sending anyone door to door. Their model classified structures as residential or non-residential from footprint, shape, and proximity to roads and neighbors, and reached 85% accuracy nationwide. We loaded Loamin's results into the Crosscut App and produced printable maps marking the communities with the most spray-eligible structures, along with health facility catchment borders and schools for teams to navigate by. Teams still checked buildings on the ground, but they started from a classified map instead of a blank one, and the count was ready in time to order against.
Malaria has been the bulk of our spraying work, and these same mapping approaches carry over to mass drug administration, including lymphatic filariasis in Haiti with The Carter Center and NTD campaigns across WHO AFRO.
Field work and desk work in one shareable catchment map
Teams still have to go into communities to record sprayable surface, wall material, and who sleeps in each building. What the operational manual changes is what information those teams have beforehand. They go out with a structure count to check rather than a blank sheet to fill, and whatever they correct goes back to the same map the rest of the campaign runs on. Spraying works when teams find the right houses. The map is how a program knows they did.
The Crosscut App is free to use for IRS campaigns, you can build these maps yourself, and can share them with your team. If you want help sizing a spray round or working through the data you already have, our advisory team does that work with programs directly.
Frequently asked questions about indoor residual spraying campaigns
What is geographical reconnaissance in an IRS campaign?
Geographical reconnaissance is the census and mapping exercise WHO asks malaria programs to run before spraying begins. Teams record where people live, map every structure inside the target area, and give each one a unique number painted on the door. That number tracks the building through the spray round and becomes the denominator for coverage reporting afterward.
What maps do you need for an indoor residual spraying campaign?
WHO's operational manual lists five: the mapped limits of the target area, every structure inside it counted, a list of structures with sprayable surface estimates, an operating zone for each spray team, and recording forms for the counts. Program managers use the same map to site field camps and plan transport routes.
How do you calculate how many spray operators you need?
Divide the structures to be sprayed by the number one operator handles per day, then divide again by the length of the campaign. WHO puts a day's work at 8 to 10 structures where houses cluster, up to 15 in dense areas, and as few as five where structures scatter. Terrain changes the answer, which is why identical building counts can mean very different staffing.
How do you divide a district into spray team areas?
The manual sets requirements rather than a method: every village covered, no team given more ground than it can spray, and operators never so dispersed that supervision and resupply break down. Catchment area algorithms split a district into zones carrying similar building counts, which is the number IRS workload follows.
Which buildings get sprayed during an IRS campaign?
For malaria, teams spray walls, ceilings, and eaves throughout a house, leaving out kitchens and any room where someone sick or elderly cannot be moved. Shops and schools usually stay off the list. Metal surfaces get skipped because insecticide runs off without leaving a residue. The rules shift by vector, so an Aedes campaign sprays only the lower 1.5 meters of a wall.
Can you plan an IRS campaign without GIS software?
Yes. WHO accepts hand-drawn sketch maps showing houses to spray, access routes, and camp locations, as long as the picture is complete and current. Free browser tools cover the same ground without a GIS specialist, and the Crosscut App exports printable maps teams can carry into the field.
Related Posts
What WHO's routine immunization guide says about catchment area maps

What the AMP toolkit says about catchment area maps for ITN distribution campaigns
What WHO's immunization campaign guide says about catchment area maps
