
What GPEI's polio outbreak guidance says about catchment area maps

When a laboratory confirms a case of poliovirus, the response runs on a fixed clock. Countries have 72 hours to assess the risk, 14 days to run an optional local vaccination round, and 28 days to launch the first large-scale campaign. Each of those steps depends on catchment area maps showing where children live and which vaccination team will reach them.
The Global Polio Eradication Initiative (GPEI) covers this work in two documents. The Standard Operating Procedures for Responding to a Poliovirus Event or Outbreak (2026), called the SOPs below, set the timelines and decisions for an outbreak response. WHO's Best Practices in Microplanning for Polio Eradication (2018), called the Best Practices guide below, covers the house-to-house campaign microplan, including the operational map vaccination teams require.
This article builds on the polio information in our program-by-program microplanning guide. We'll cover the maps to have ready before an outbreak, how maps shape the response, what every team map should show, and how the Crosscut App helps teams build them in one project.
The polio outbreak response clock starts at Day 0
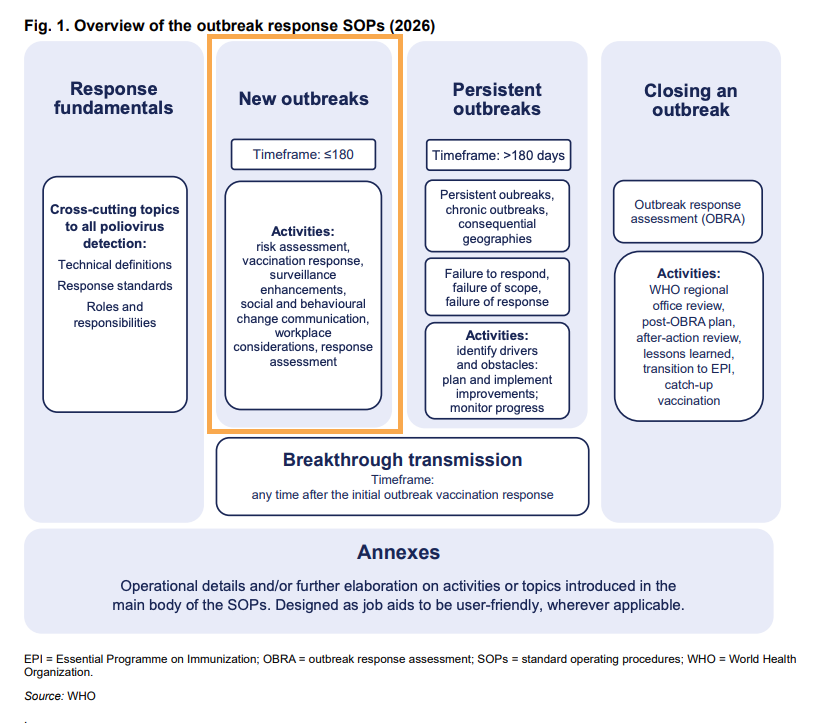
The SOPs define Day 0 as the date WHO receives notification of a laboratory-confirmed poliovirus case, and every deadline in the response counts from that date. GPEI gives countries 28 days to launch the first supplementary immunization activity (SIA), a large-scale vaccination campaign, and 84 days to complete three. The goal is to stop transmission within 120 days.
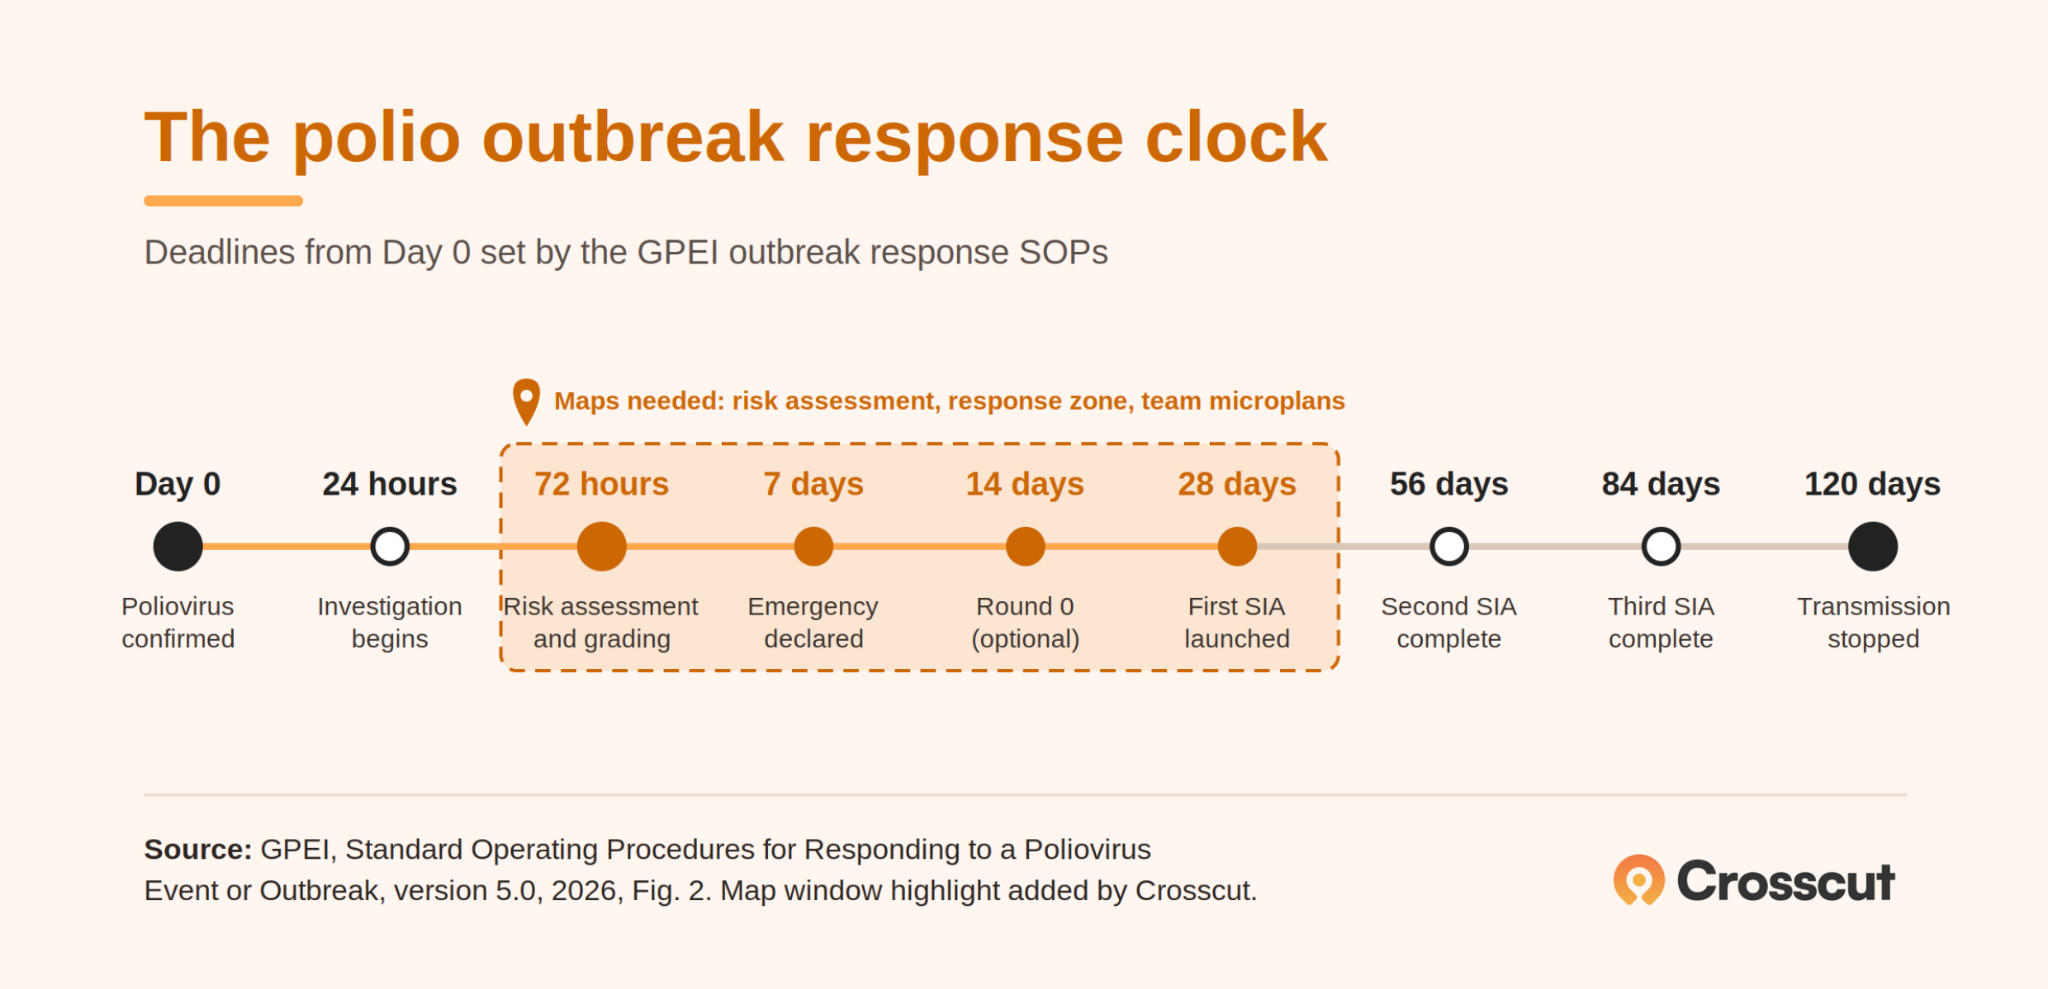
The first mapping task comes with the risk assessment, which is due within 72 hours. To show where the virus could spread and who is most at risk, the SOPs ask for GIS maps of:
- High-risk populations, urban areas, and border areas
- Areas with access challenges
- Population movement along roads, rivers, and migration routes
One challenge is that many districts don't have a GIS specialist on staff, and the SOPs treat GIS mapping as a specialist skill that GPEI surge support brings in from outside. Waiting for that support to arrive can stretch a district’s timeline beyond the suggested 72-hour deadline.
Tools like the Crosscut App let health teams make these maps themselves without waiting for GIS consultants. With boundaries and population data already loaded for countries across sub-Saharan Africa, the district team just uploads its list of health facilities, and the free mapping software draws each facility's catchment area with a population estimate.
Operational maps to have in place before a polio outbreak
Much of what the risk assessment asks for can be mapped before any virus is detected. The SOPs' access and risk mapping checklist, written for conflict settings where teams also need to consider safety, lists what a district should have on its maps:
- Settlement boundaries clearly marked in microplans
- Exact locations of functional health facilities and operational hubs
- Environmental surveillance catchment areas
- Population estimates for every permanent settlement, plus displaced, nomadic groups
- Transit points such as markets, bus stations, border crossings, checkpoints, and river crossings
Where conflict is ongoing, the SOPs ask teams to refresh this mapping every two weeks, or right away when the situation on the ground changes. Any district can use the same list to build a baseline before an outbreak. Border districts are also asked to map high-risk populations and share lists of villages and hamlets with the district across the border.
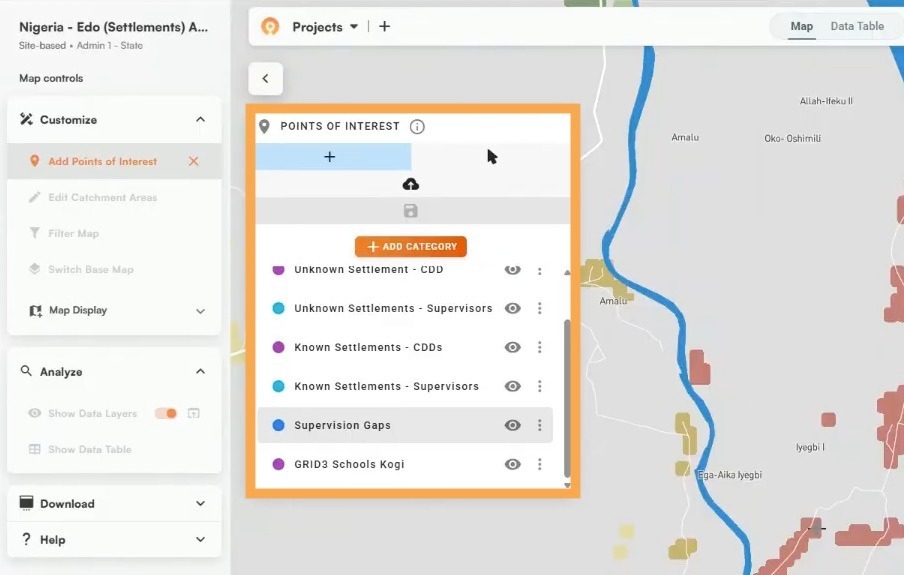
Many districts work from settlement lists that are years old. Settlement-based maps in the Crosscut App build areas around every place people live, so the settlement list comes from where buildings stand today. Markets, bus stations, and border crossings go on the same map as points of interest in the Crosscut App.
Drawing the polio outbreak response zone
The SOPs ask countries to vaccinate the area with detected transmission, called the outbreak zone, plus the surrounding high-risk zone the virus could reach next. Surveillance and routine immunization strengthening continue in the lower-risk areas beyond both.
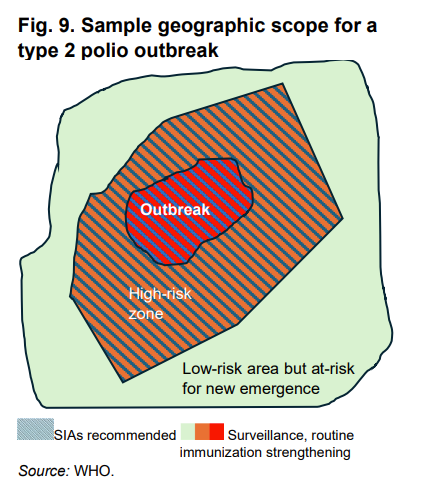
As much as is reasonable, the SOPs say population movement should dictate the scope rather than political or administrative boundaries. If the response stops at a district line that people cross every market day, the virus can turn up outside the vaccinated area. The SOPs call this a failure of scope, and it leaves a country chasing transmission instead of getting out in front.
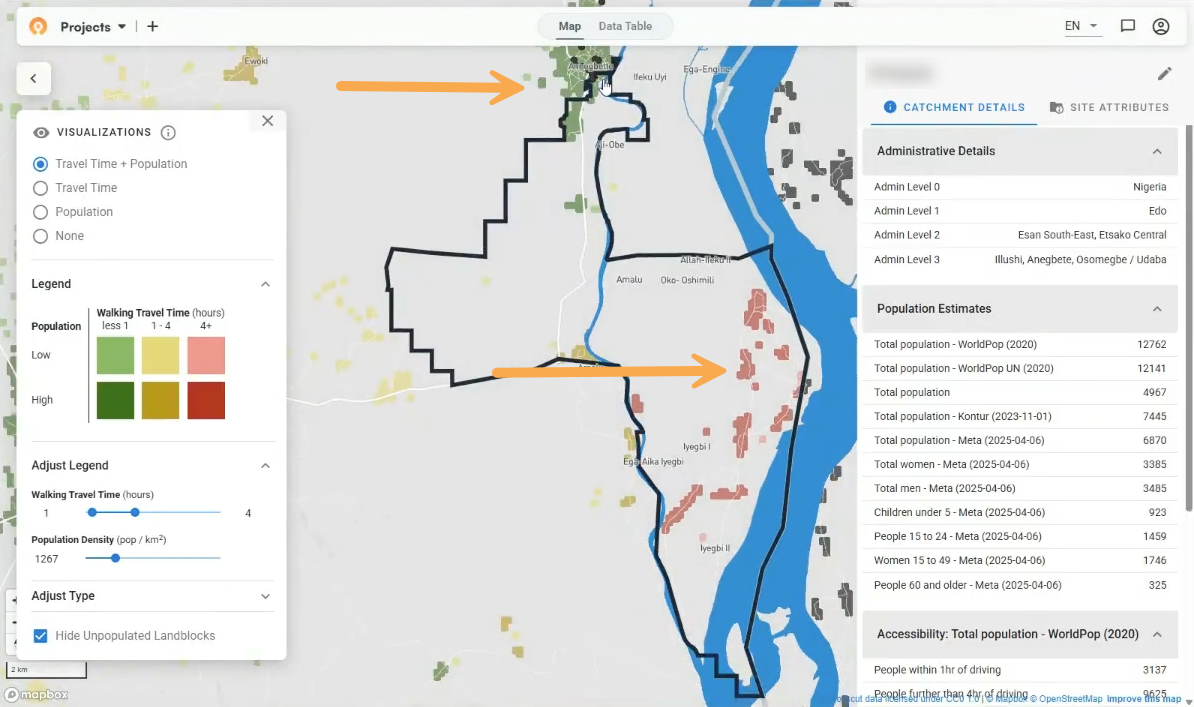
Travel-time maps in the Crosscut App show how communities connect to markets and health facilities across district lines, using roads, terrain, and slope. The interactive heat maps help planners visualize accessibility to see where the high-risk zone should extend.
Every polio vaccination team needs its own map
Once the team establishes the response zone they’ll cover, planning moves down to the vaccination teams who will go house to house. The Best Practices guide covers this stage, and asks for every team to have a daily movement plan and its own map.
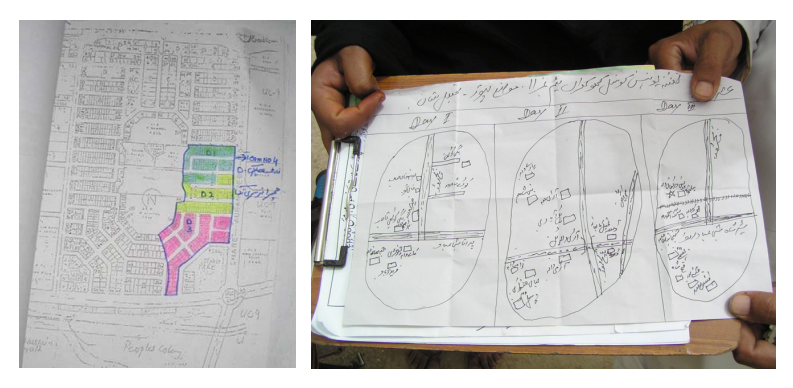
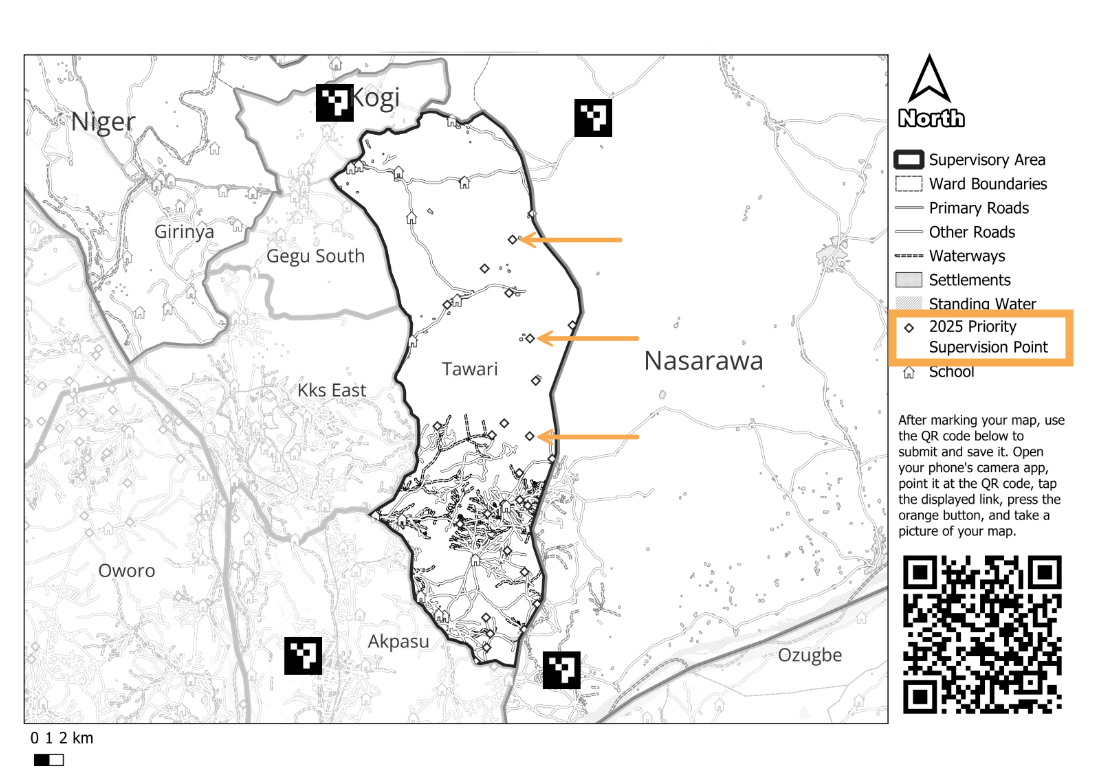
Each team map shows the edges of the team's working area, where the team starts and finishes each day, and the route between houses. It also marks hamlets away from the main roads. In towns, team areas are often shaded by day, so supervisors can see where every team will be.
Supervisors tend to manage these maps. Before a campaign, they confirm that every team’s area is clear and add any new settlements where people often move. The guide's readiness checklist then asks whether the maps show catchment areas and where posts, teams, and supervisors will be each day. Fair supervisory areas in the Crosscut App give supervisors a starting point by dividing a district into balanced, contiguous areas based on population.
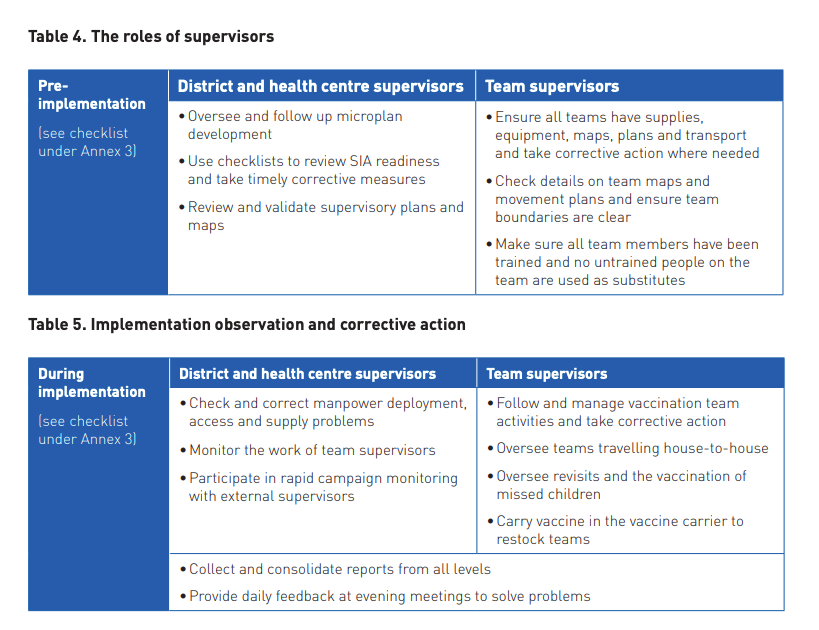
Source: WHO, Best Practices in Microplanning for Polio Eradication, 2018, Table 4.
Hand-drawn maps and the 84-day polio campaign window
Hand-drawn maps have supported polio campaigns for a long time. The difficulty with manually drawing maps is that SOPs call for three SIAs within 84 days and say to revise microplans between rounds based on where monitors found missed children. With paper maps, that means redrawing and recopying the same maps several times in a few weeks.
The bigger risk is the hamlet off the main road that never makes it onto a team map. The poliovirus can keep circulating in quite small groups of unvaccinated children, so missing even one of these settlements can keep an outbreak going.
The Crosscut App maps settlements by grouping buildings detected in satellite imagery, so hamlets appear on the map whether or not they're on the settlement list. That helps teams find the communities a campaign is missing. If the monitoring team reports missed children, staff can edit the map and print updated copies for the next round.
Polio surveillance also runs on catchment areas
While vaccination teams work through each round, surveillance teams track whether the virus is still circulating, and the SOPs keep this going for at least 12 months after the last detection. Much of that work relies on the environmental surveillance catchment areas.
Each environmental surveillance site collects sewage from a catchment area. When linked detections come from two sites whose catchment areas don't overlap, the SOPs treat it as local transmission and declare an outbreak. Investigators then describe each site's catchment area, from population and movement patterns to health facilities, schools, and bus stations nearby.
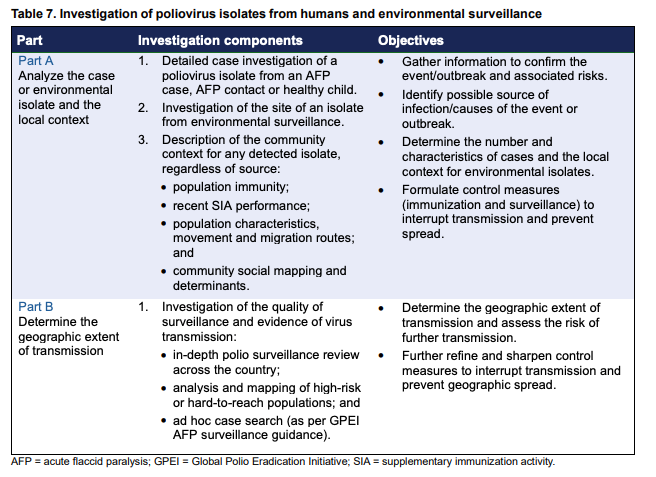
Teams can plot surveillance sites and cases on the same catchment maps they built for vaccination. With granular risk maps, they see outbreak risk community by community instead of waiting for district totals to rise.
Where the Crosscut App fits polio outbreak microplanning
The Crosscut App was built around WHO microplanning guidance, and it supports most of the mapping steps in both polio documents.
The SOPs give countries 28 days from Day 0 to the first large-scale campaign. A district that already has settlement maps, population estimates, and team areas when a detection comes in can spend those days on vaccines, training, and community engagement.
The Crosscut App is free to use, so districts can build these maps now, before an outbreak. If you want help preparing maps for an outbreak-prone area, our advisory team works with programs on microplanning and disease surveillance.
Frequently asked questions
What maps are needed for a polio outbreak response?
The GPEI outbreak response SOPs ask for GIS mapping of high-risk populations, urban areas, border areas, access-constrained areas, and population movement as part of the risk assessment due within 72 hours of Day 0. The Best Practices guide adds an operational map for every vaccination team and a supervisory map for every supervisor. Settlement-based maps in the Crosscut App and points of interest cover the settlement and transit point mapping.
What is Day 0 in a polio outbreak?
Day 0 is the date WHO receives notification of a laboratory-confirmed poliovirus with genetic sequencing results. Every deadline in the SOPs counts from Day 0, including the 72-hour risk assessment, the 28-day deadline for the first SIA, and the goal of stopping transmission within 120 days.
What should a polio vaccination team map show?
The Best Practices guide asks each team map to show the limits of the team's working area, start and end landmarks for each day, the route between houses, and hamlets outside the main roads. Team areas are shaded by day, and supervisors check that boundaries are clear before the campaign. Printable maps from the Crosscut App give each team a paper copy.
What is a failure of scope in polio outbreak response?
A failure of scope happens when a vaccination response covers too small an area or too narrow an age group, and poliovirus is later detected outside the vaccinated zone. The SOPs say scope should follow population movement rather than administrative boundaries. Travel-time maps help show how communities connect across district lines.
Do you need GIS software for polio microplanning?
No. The Best Practices guide accepts hand-drawn team maps, and many polio programs still use them. The Crosscut App is a free browser tool that now covers the mapping steps, from settlement maps to balanced team areas, without QGIS or ArcGIS training. The Crosscut App builds these maps from a spreadsheet of coordinates and exports them for printing.
Which WHO guides cover geospatial microplanning and catchment area mapping?
Each health program has its own guidance. The GPEI outbreak response SOPs and the Best Practices guide cover polio, Immunization in Practice covers routine immunization, and WHO's immunization campaign field guide covers supplementary immunization activities. Our program-by-program reference collects all of them with links to every source document.
More from the microplanning guides series
- Microplanning guides for health campaigns: A program-by-program reference
- What WHO's immunization campaign guide says about catchment area maps
- What WHO's routine immunization guide says about catchment area maps
- What the AMP toolkit says about catchment area maps for ITN distribution campaigns
- What WHO's indoor residual spraying manual says about catchment area maps
- What WHO's NTD microplanning manual says about operational maps
Related reading
Related Posts
What WHO's routine immunization guide says about catchment area maps

What the AMP toolkit says about catchment area maps for ITN distribution campaigns
What WHO's immunization campaign guide says about catchment area maps
