
What WHO's NTD microplanning manual says about operational maps

Neglected tropical disease (NTD) programs rely on a strategy of preventive chemotherapy to reduce the prevalence of their target diseases. Preventive chemotherapy is the practice of administering treatments to all members of a given population even if they’ve never been infected with the disease in question. This generally takes the form of regularly scheduled mass drug administrations (MDAs) where health programs organize large numbers of these treatments. It is essential for these MDAs to treat a certain percentage of the population in order to meet long term goals associated with disease control and eradication, making it critical for planners to be strategic and rigorous when planning these campaigns.
In 2022, WHO and the Pan American Health Organization (PAHO) published a microplanning manual for preventive chemotherapy that covers how NTD programs prepare for a mass drug administration. The manual actually starts with the mapping process.
This article goes deeper into the NTD section of our program-by-program microplanning guide. The guidance below comes directly from WHO and PAHO's manual, so you can see which catchment maps your team needs before the campaign starts.
NTD microplanning works with two spatial units
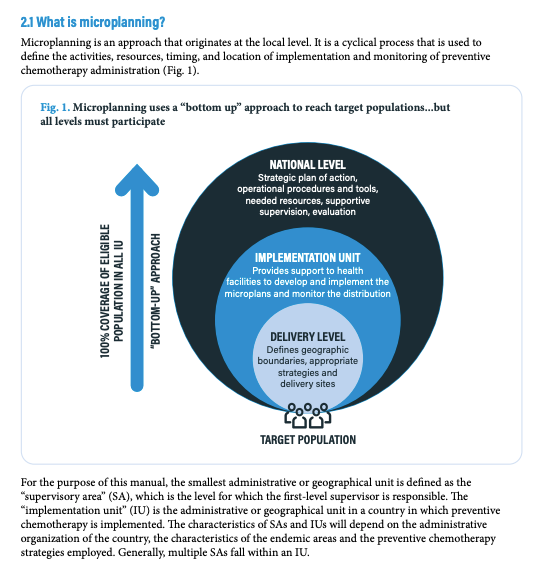
The first planning units are supervisory areas – the patch of land one first-level supervisor covers, which is often the catchment area of a community health facility. The supervisor oversees the community drug distributors (CDDs) who hand out the medicine, at schools, at fixed points, or door to door. The implementation unit (IU) is the larger area where preventive chemotherapy gets administered, with several supervisory areas inside it.
Both of these units require full coverage of every locality, and no overlap or missing areas. It is a bottom-up planning approach:
- Supervisors build their own microplans with community stakeholders.
- The IU level compiles them.
- The national level builds its action plan on top.
Starting at the supervisory area is deliberate. Supervisors tend to know which communities sit where and which ones got missed last time, and the manual says that this local, bottom-up knowledge is what makes a microplan work.
Capturing accurate map boundaries is the time-consuming part. The manual points out that microplans have historically been paper-based, but digital methods improve planning efficiency and map accuracy, especially in defining supervisory areas.
As we'll show throughout this article, tools like the Crosscut App divide an IU into supervisory areas with no gaps between them and no community in two areas at once.
What information belongs on a supervisory area map
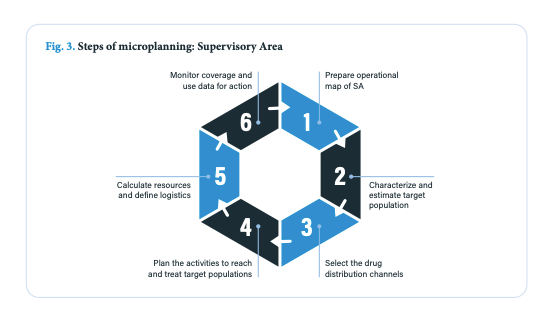
The manual runs microplanning in six steps at both levels: prepare the operational map, estimate the target population, choose the distribution channels, plan the activities, calculate resources and logistics, then monitor coverage during the campaign. The map comes first because every step after it depends on knowing the ground.
The operational map should include:
- Clearly defined borders. Agreed with the IU before supervisory area planning starts, and marked against features an outsider could find, like rivers and roads.
- Villages and communities. Down to individual houses where that makes sense, grouped where it does not.
- Infrastructure and geographical features. Roads, bridges, railways, stations, rivers, streams, and lakes, along with anything likely to cause trouble during the campaign, such as flood-prone ground.
- Landmarks. Schools, markets, workplaces, places of worship, and health centers.
- Approximate distance or travel time between features.
The manual suggests testing maps by asking community members to look at the finished map and checking if they recognize their own community. Figure 5 shows a good example, with fixed points, households, schools, and hard-to-reach populations each marked with their own symbol.
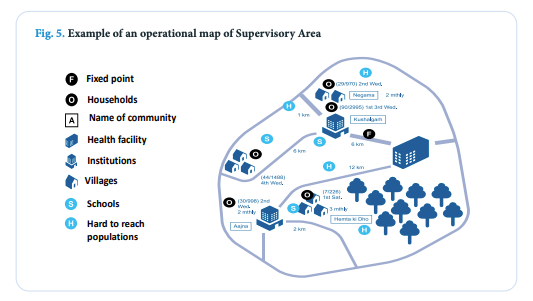
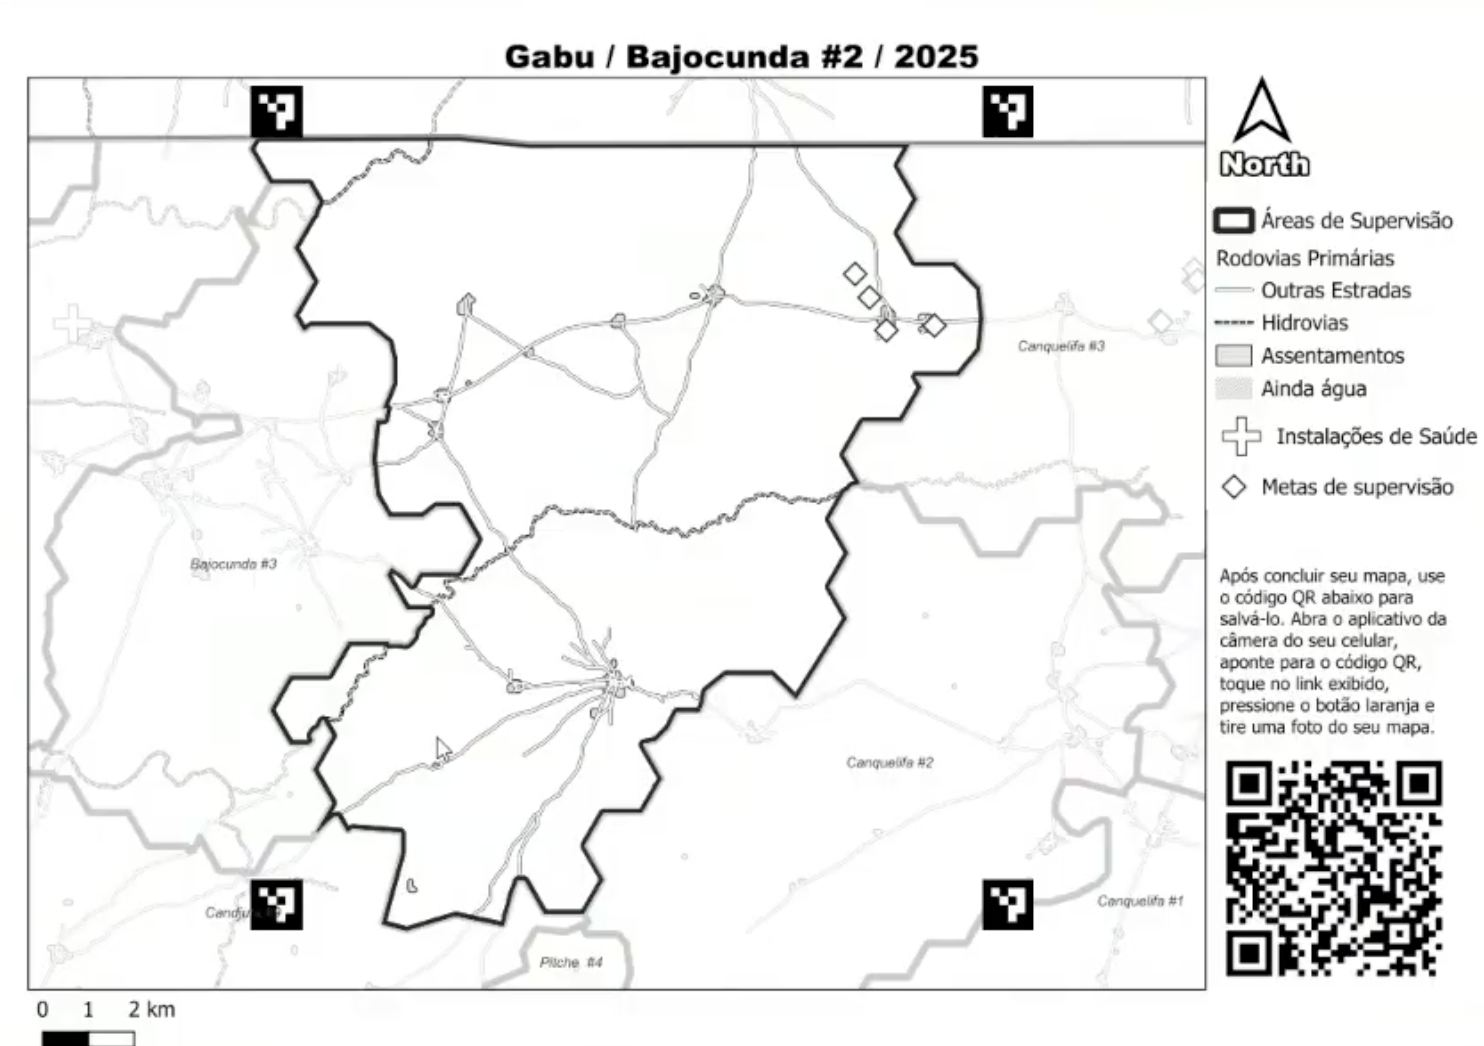
The Crosscut App includes the same features for every sub-Saharan African country, so roads, rivers, settlements, and health facilities are on the map before work preparing a supervisory area starts. They can also add local knowledge such as hard communities to reach, where the fixed points go on the map, and which ground might flood. Crosscut then exports the map as a printable PDF, so a supervisor working on paper gets the same type of map above without having to draw it.
Fixing the “no-man's-land” problem
The full coverage rule can break down at the edges where boundaries meet. A supervisor might draw the ground they know and stop at their border, and the neighboring supervisor does the same, but the two borders rarely meet. The strip in between belongs to nobody's microplan.
Figure 2 shows five supervisory areas with red question marks sitting in the gaps between them. The problem is people live in those gaps, but no distributor is assigned to them, no target population counts them, and the coverage percentage still comes out looking fine.
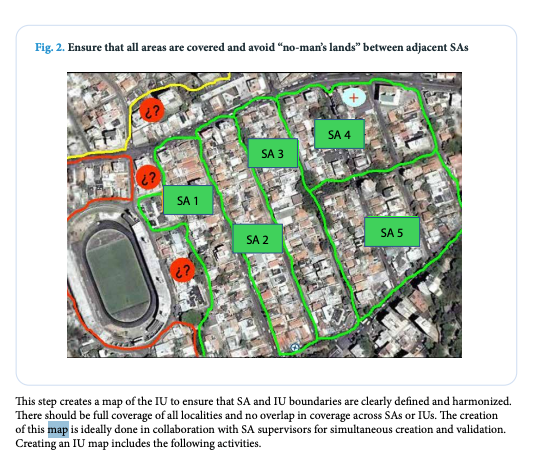
The manual suggests three points in the process where you can fill in those gaps: A supervisor checks borders with neighboring supervisors while drawing. Once the map is finished, three local stakeholders who were not involved review it. Then the IU compares all the finished maps side by side. This process is thorough, but it takes time and is prone to human error.
With the Crosscut App, instead of five supervisors drawing five maps that have to be reconciled afterward, fair supervisory areas take the whole IU and cut it into the number of areas an NTD program needs. Every piece of ground inside the unit lands in one area, so there is no unclaimed strip for a review to catch. Crosscut can then help divide teams of CDDs within those supervisory boundaries, which we cover next.
Community drug distributor maps
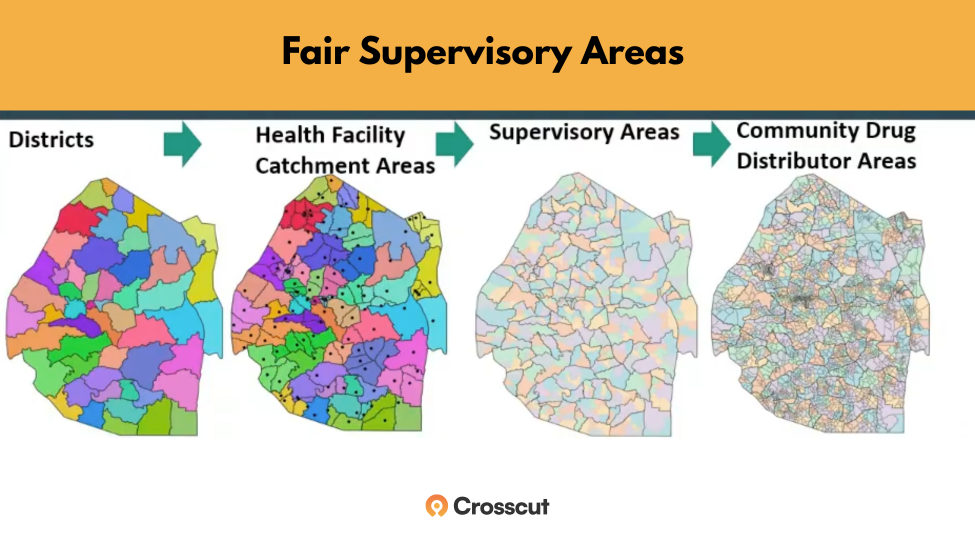
Districts divide into health facility catchment areas, those into supervisory areas, and supervisory areas into CDD zones. Every level is the same operation at a smaller scale. Building them together in the Crosscut App means a catchment area can be divided again without redrawing anything above it.
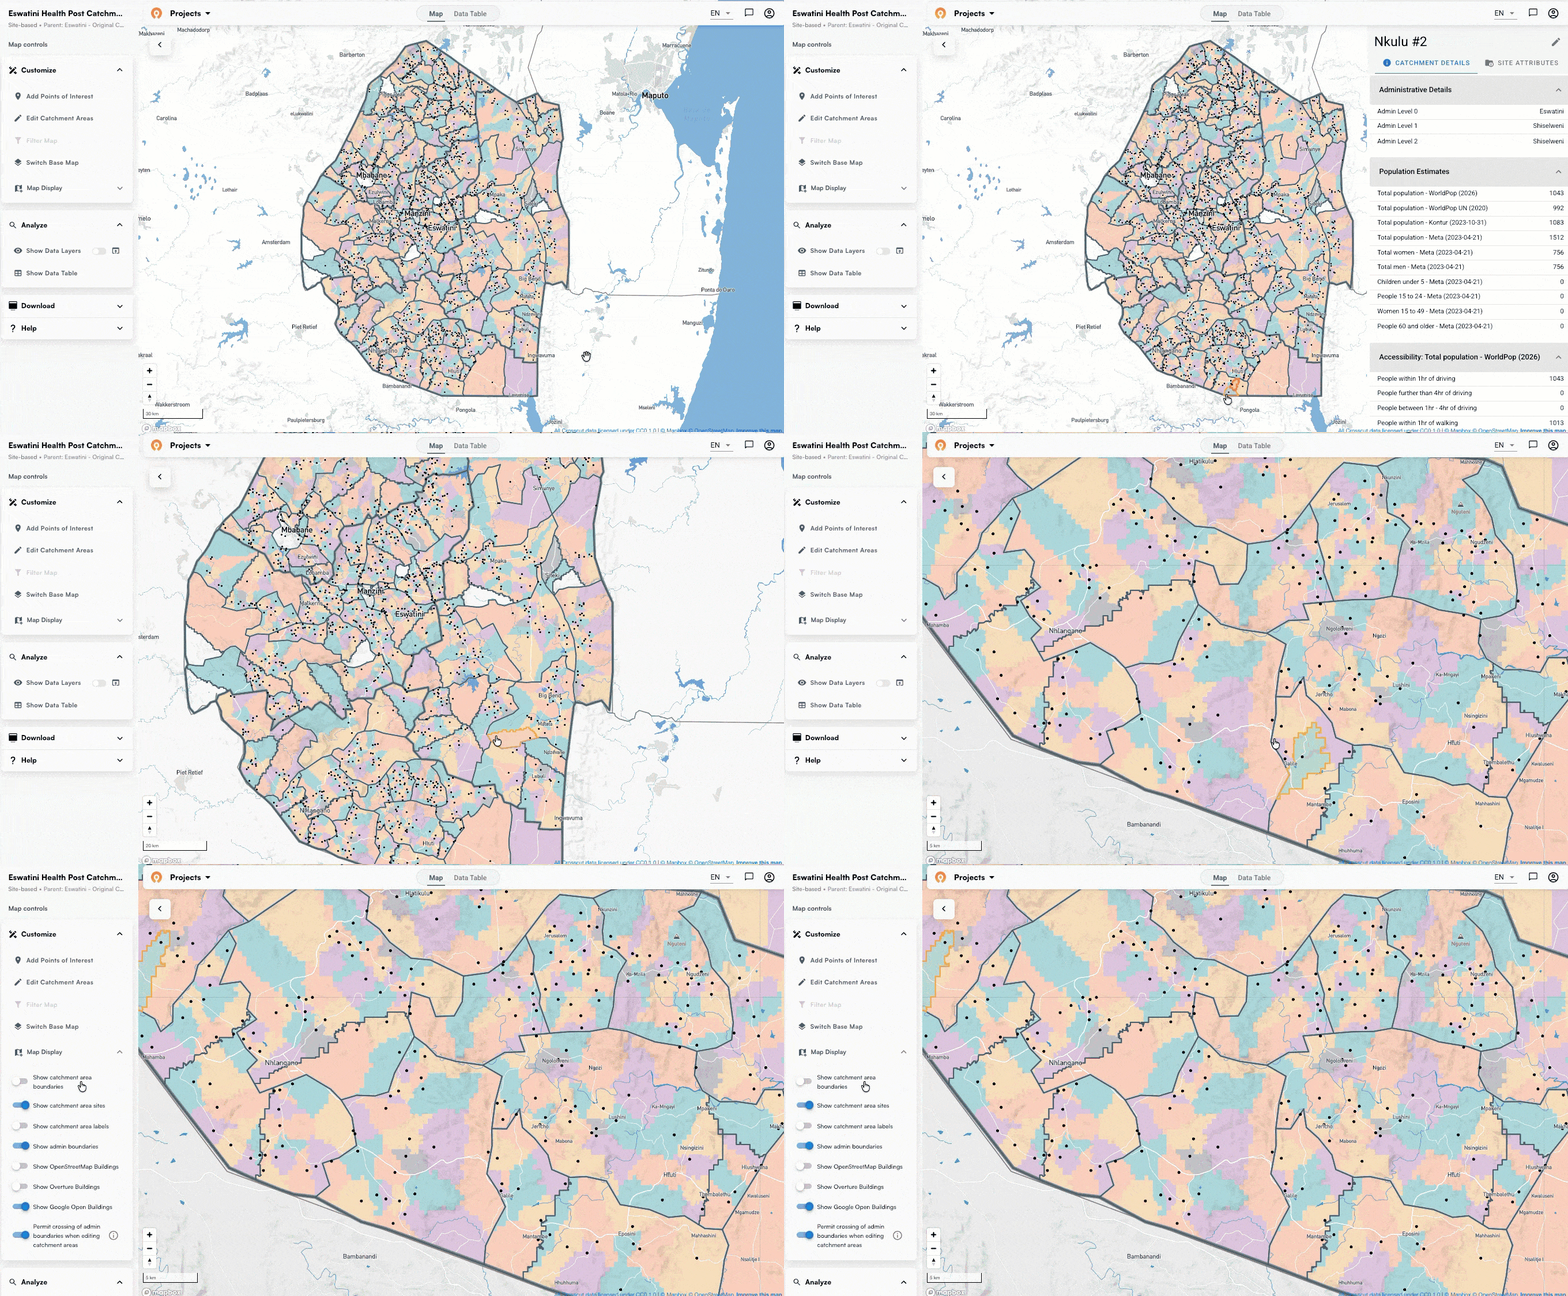
The manual recommends creating the IU map alongside the supervisors rather than separately, so boundaries get drawn and validated at the same time. It also asks the IU to confirm that the boundaries on each supervisor's operational map match the ones on the IU map. You can generate both levels in one catchment job within the Crosscut App.
Supervisors can also still drag or edit a boundary where they know the ground better, and both levels will update. Everyone works in the same shared project rather than emailing files back and forth.
Choosing how to reach people
In Step 2 of the manual, supervisors estimate the target population in each community, which becomes the denominator behind the coverage threshold. In Step 3, they decide how to reach that population. Most NTD programs use three delivery channels the manual describes:
- Schools. Children get treated where they already gather.
- Fixed points. Temporary posts where people come to collect medicine.
- Door to door. CDD pairs walk the community and treat people at home.
If you already know where schools and fixed points are, you can use site-based catchment areas in the Crosscut App to see which communities can reach each one. For door-to-door work there are no sites, so you use settlement-based catchment areas instead, which find the communities first and build the coverage areas around them.
How to size the drug distributor teams
Step 4 is where a supervisor works out how many CDD pairs the campaign needs and where each pair goes. One CDD gives out the medicine and the other keeps records, and programs plan against two ratios: how many people one CDD covers over a campaign, usually 250 to 400, and how many CDDs one supervisor manages, usually about eight. How many pairs a supervisory area needs also depends on the travel distance between fixed points, or for door-to-door work, how many visits a pair can finish in a day.
The supervisor then divides the supervisory area into coverage areas with one per pair. The manual says those boundaries should follow roads and rivers where possible, and that each team's ground should be reasonable given the population density and the terrain. Reasonable is left to each supervisor, since they are the one who knows realistic expectations for the area.
Those two ratios give the supervisor a number to work from. You can enter them into fair supervisory areas in the Crosscut App, and it tells you how many CDDs and supervisors you need, then draws the territories. Rural territories come out smaller, because travel time takes more of the day. If your budget caps how many CDDs you can hire, set that number instead and the app splits the ground across the staff you have. The Crosscut app also generates boundaries that follow roads and rivers as per the guidance.
In Guinea-Bissau, we built supervisory areas this way, and integrated the printable operational maps for the onchocerciasis and schisto campaigns.
Keeping the microplan in one place
This article covered Steps 1 through 4 of the NTD microplanning guide, since that is where the mapping work happens. Steps 5 and 6 use the same operational maps. Resource calculations use the population in each area, and coverage monitoring compares what CDDs reported against the area they were assigned.
The Crosscut App also keeps the microplan together in one place. Boundaries, population figures, and staffing all live in the same project, and treatment data collected in CommCare, ODK, or KoboCollect comes back into the map it was planned on. Supervisors can also collect population and building counts using the Microplan Collector, which sends Excel templates by email and automatically organizes the responses as they come back.
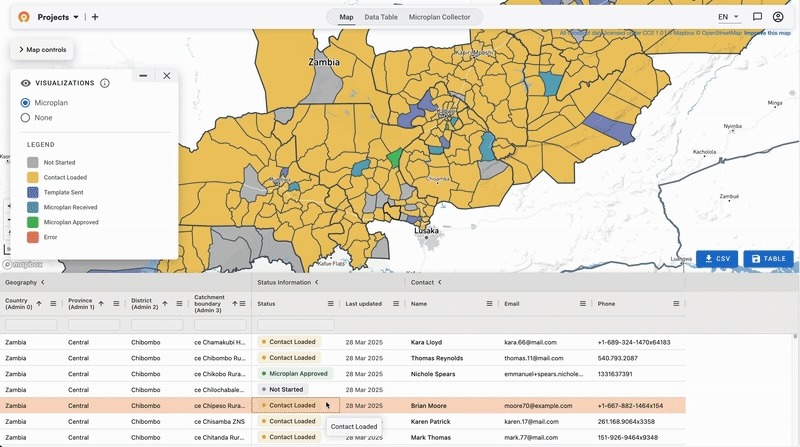
Programs rarely start with no information. A list of health facilities or fixed points, the administrative boundaries you report against, and years of previous microplans all go in. The Crosscut App is free to use, and builds the catchment areas from them without GIS expertise.
Related Posts
What GPEI's polio outbreak guidance says about catchment area maps

What WHO's routine immunization guide says about catchment area maps
What the AMP toolkit says about catchment area maps for ITN distribution campaigns
