
What WHO's immunization campaign guide says about catchment area maps

Immunization programs run supplementary immunization activities (SIAs) to reach every child in a target age group at once. A campaign covers a district or a whole country in a matter of days and it has a high coverage target to clear in order to be considered successful, so it’s essential that a team generally either knows which households it will cover before the campaign opens. For example, measles elimination needs 95% of the target group, and SIA exists to identify children who get missed during routine immunization.
In 2016, the World Health Organization published a field guide for planning and implementing high-quality SIAs using measles and rubella as examples. The guide points out districts do their microplanning nine to six months before the campaign, and goes into specific detail about the operational maps they produce.
This article goes deeper into the immunization section of our program-by-program microplanning guide. The guidance below comes directly from WHO's field guide, so you can see which catchment area maps your team needs before the campaign starts.
Microplanning starts at the health center and moves up
Microplanning for an SIA is a bottom-up process, the same way NTD microplanning workflows tend to operate. Health centers in the operational area prepare their own plans, districts aggregate them and add district costs, and the national level consolidates from there. Each plan gets validated at every level as it moves up.
Before the district microplanning workshop, participants collect background information for their catchment area. The guide specifically asks for:
- Target population estimates, broken down by subdistrict and health center.
- The rural and urban split across the district.
- Underserved, hard-to-reach areas, with the strategies suggested for reaching them.
- Schools and day cares, with names, locations, and enrolment in the target age groups.
- Hospitals, in-patient clinics, and orphanages.
- Transit points, major markets, and border crossings.
- Cold-chain inventory, showing what works, what does not, and where the gaps sit.
- District maps showing subdistricts and major access routes.
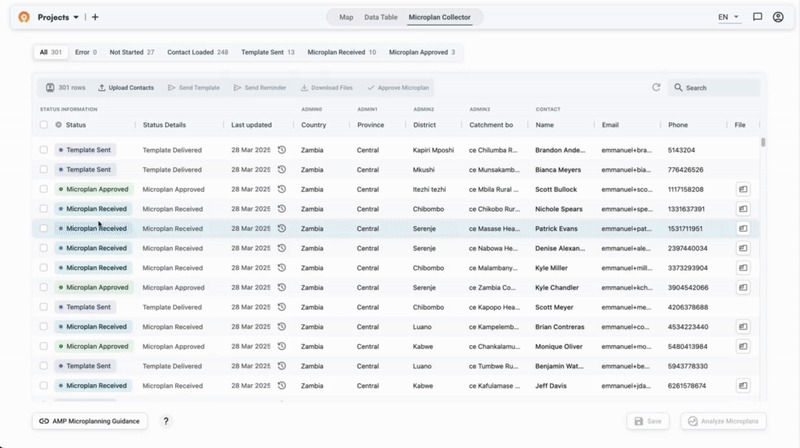
Health centers tend to supply every item on that list. WHO asks every district to use the same planning form so the information consolidates cleanly, to collate it sequentially upward, and to validate each microplan as the data arrives. In a district with dozens of health posts, that is a lot of spreadsheets moving by email.
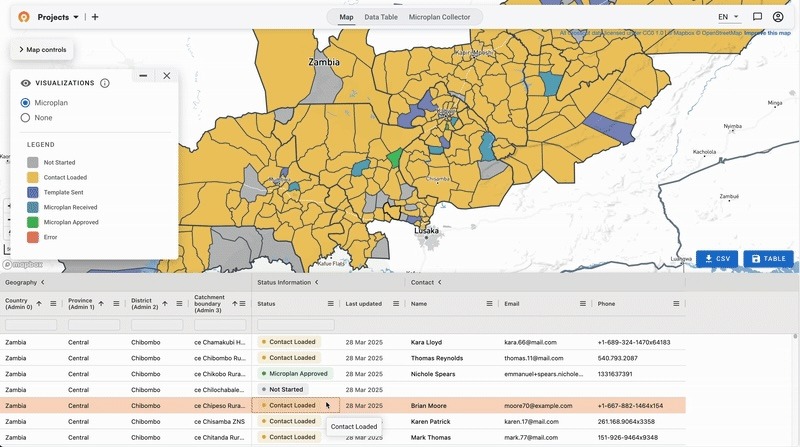
The Crosscut App includes the Microplan Collector to manage this process and connect the maps directly to your campaign data. Health centers still fill in an Excel template and email it back, which is the workflow they already use, and the district gets one compiled dataset instead of a folder of attachments.
WHO asks for precise catchment maps of each health center
For the mapping itself, the field guide suggests using tools like Google Maps or another electronic mapping system to create precise operational maps of health facility catchment areas, so the area each health center is responsible for is clearly defined. The same maps serve the campaign and routine immunization.
In the Crosscut App, you can draw those areas from a list of health facilities, one catchment per site, and keep them inside whatever administrative boundary the district reports against. The rest of the background list is locations, so schools, markets, transit points, and border crossings go on the same map as points of interest. Your team can add to them as planning goes on, marking a broken cold-chain unit or a settlement nobody reached last round.
Your population estimate sets what coverage can mean
Once the operational maps exist, the campaign gets measured against them. Administrative coverage during an SIA is the number of children vaccinated divided by the number of children in the microplan, so the population figure a district puts in those catchment areas decides what every coverage report means afterward.
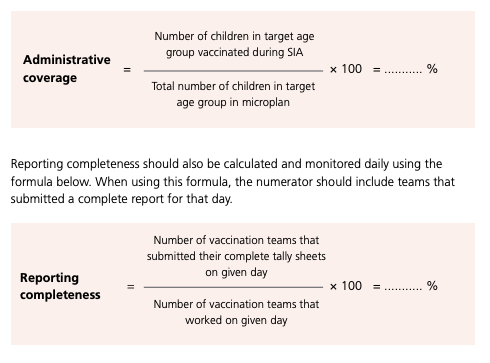
The denominator is the microplan's own population estimate, so a lot of work goes into getting it right. WHO points out that experience from polio eradication showed population figures and official census data are not consistently reliable for vaccination purposes, which is a problem when the target is 95% of a group you have to count first.
The guide offers a few ways to build a better figure:
- Take a percentage of the total population by age range, where age-specific counts are not available.
- Use routine immunization records, specifically the number of children who received BCG or a first dose of DTP-containing vaccine.
- Line-list children by household, with supervisors working through women's groups and community leaders.
- Use the highest figure when the sources disagree, so the campaign does not run short of supplies.
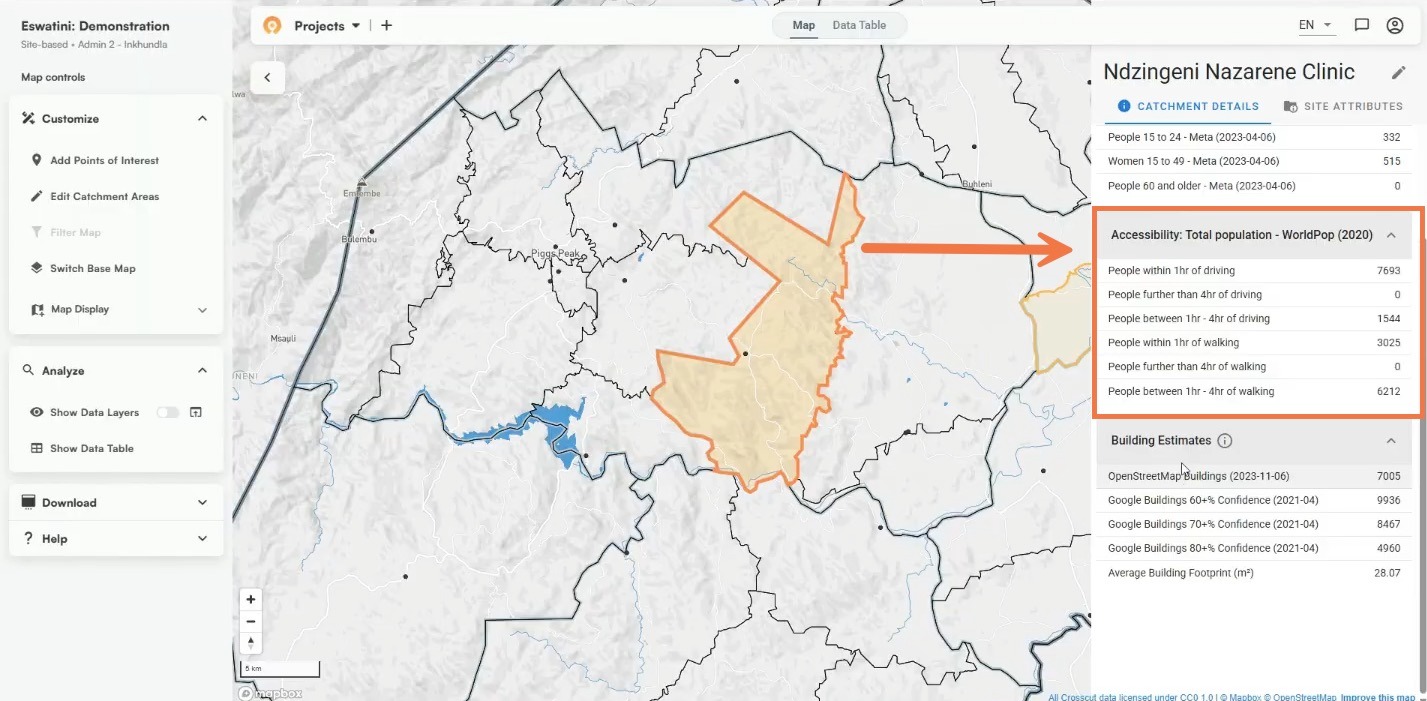
The remaining problem is that a campaign can still report strong coverage and miss children who were never counted. The Crosscut App returns population estimates from WorldPop, GRID3, Meta, and Kontur for every catchment area it draws, alongside a building count, so a district can check what health centers submitted against four independent sources.
Travel time separates a fixed post from a mobile team
The guidance notes that the primary objective of a measles and rubella SIA is reaching the unreached. Good microplanning is focused on identifying underserved and hard-to-reach populations. Fixed posts serve communities that can get to them, and mobile posts exist for the villages that cannot reach those locations.
The Crosscut App shades each catchment area by how long the journey takes on foot, using real-world features like roads, terrain type, and steepness. You can see the accessibility view across a whole district and pick out the communities sitting beyond four hours (or whatever threshold you specify), which are the ones that need a different plan.
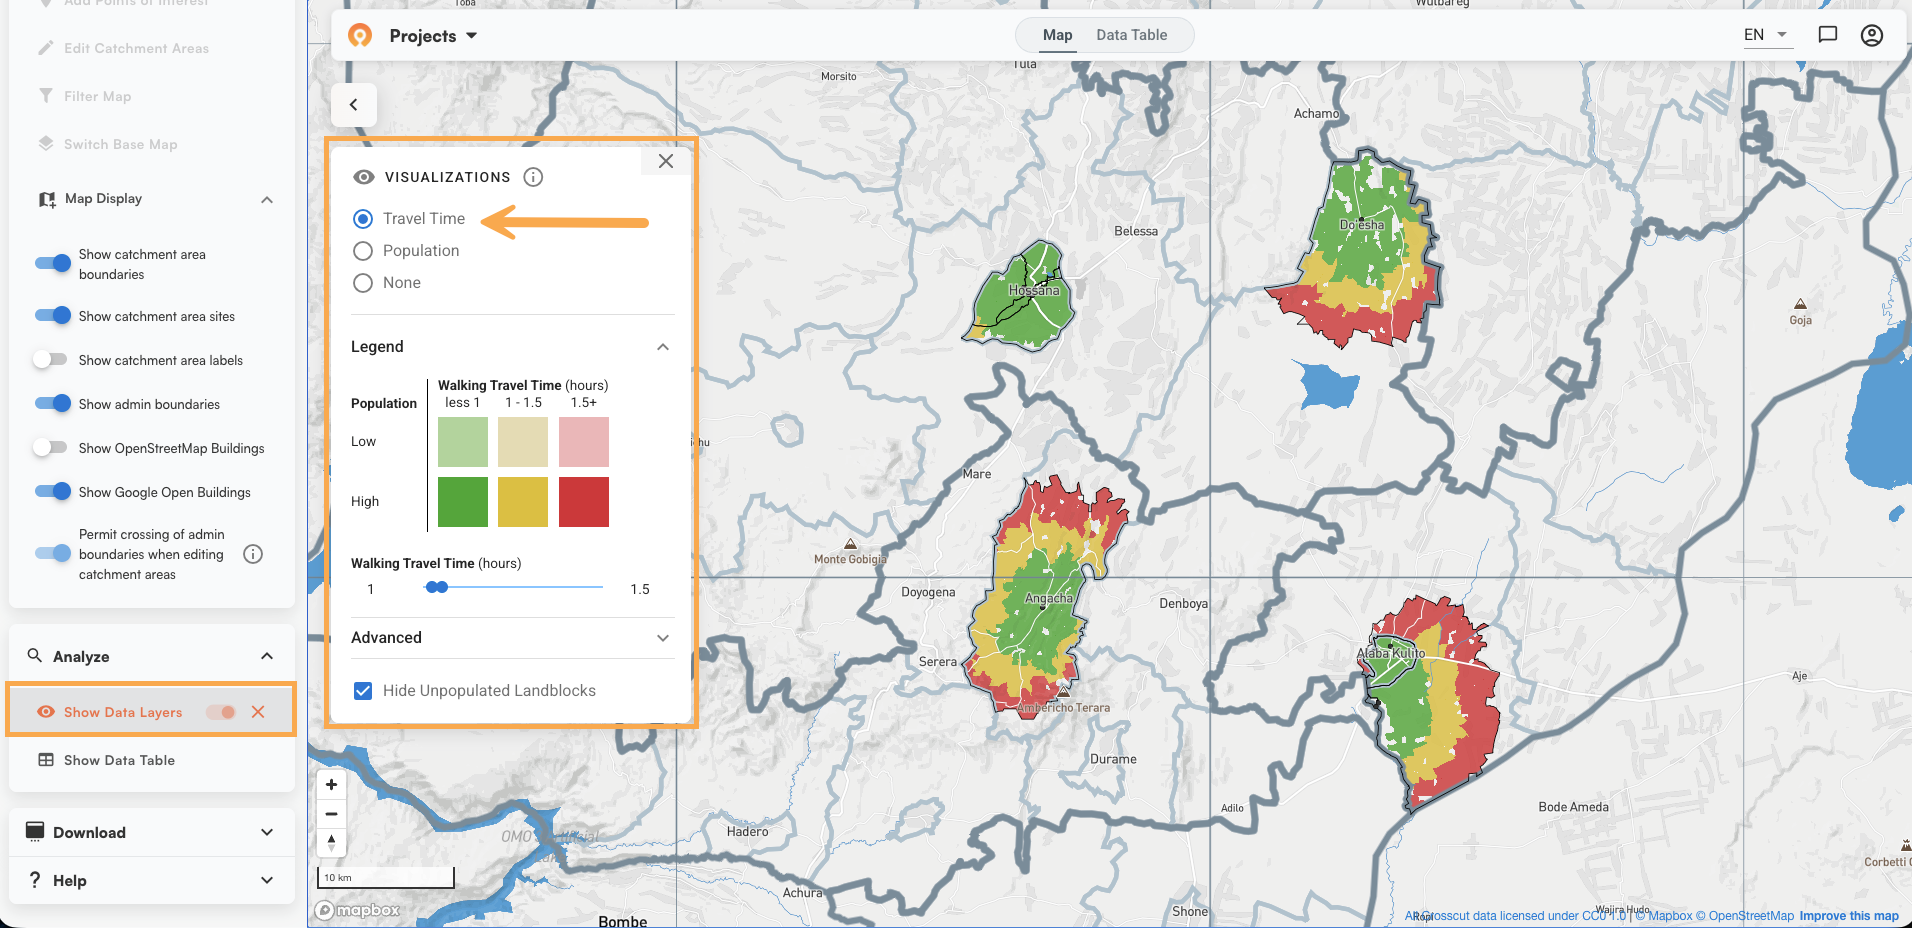
Communities within range can come to one of the fixed posts. The people outside it need a team to come to them.

Every post needs a defined area inside a catchment
The fixed posts are permanent health facilities and temporary sites set up for the campaign. The guide's list of temporary venues include schools, churches, mosques, local administrators' offices, bus depots, roadblocks, market areas, border crossing points, and village squares. Mobile posts cover villages and settlements too small or remote to have a facility of their own.
Each post serves an area, and every one of those areas sits inside a health facility catchment the district already mapped. In the Crosscut App you can nest one level of catchment areas inside another, so the facility catchment becomes the outer boundary and each post's area sits inside it. Every community lands in one post's area, so a campaign can say which team is responsible for which households before anyone sets out.
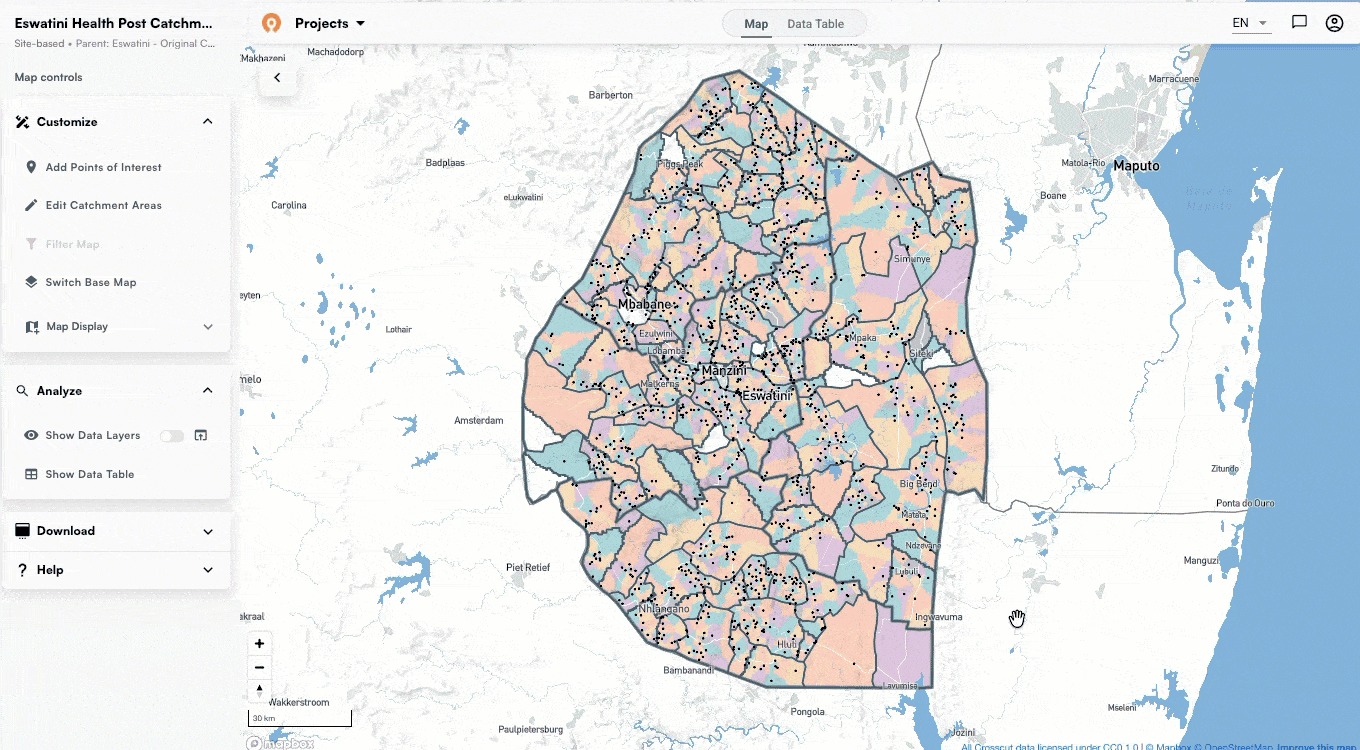
We built maps this way across the Gambia. The project included geocoding roughly 400 immunization posts nationwide so every post had coordinates that could be converted to catchments, rather than just existing as name on a spreadsheet assigned to a health facility .
Splitting a post area into one zone per campaign day
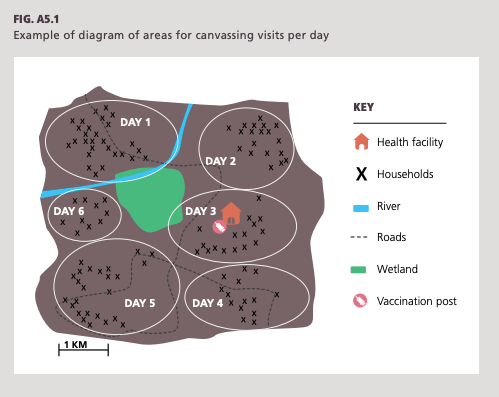
Some campaigns send canvassers ahead of the vaccination teams, going house to house to tell families when and where to come. A canvasser cannot cover a whole post area in one day, so the guide splits it by day instead.
The map diagram at the top of this article shows what that looks like. One catchment area, six zones, one per day of the campaign, with the health facility, the vaccination post, the river, the wetland, and the roads drawn in. The canvasser's workplan lists which neighbourhood each day covers.
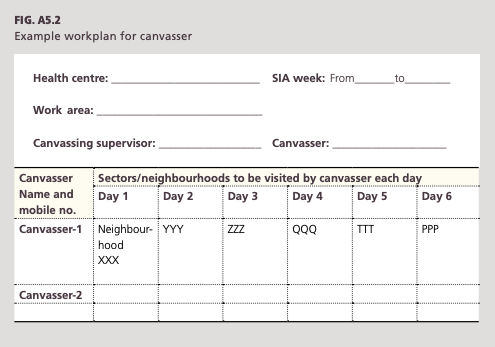
The guide sets the workload those zones have to respect so teams end up with roughly the same amount of work. Temporary and mobile teams are expected to reach 100 to 150 children a day in urban areas and 75 to 100 in rural ones, and the geographic area of responsibility for each team has to be defined and given to the team and its supervisor.
Drawing six zones by hand is straightforward. Making them even is the challenge for most teams, because a sketch map does not tell you how many households sit in each one. The Crosscut App can help split the post area into day zones with a population and building count on each, and exports them as printable maps, one per canvasser.
One supervisor, four teams, one working day
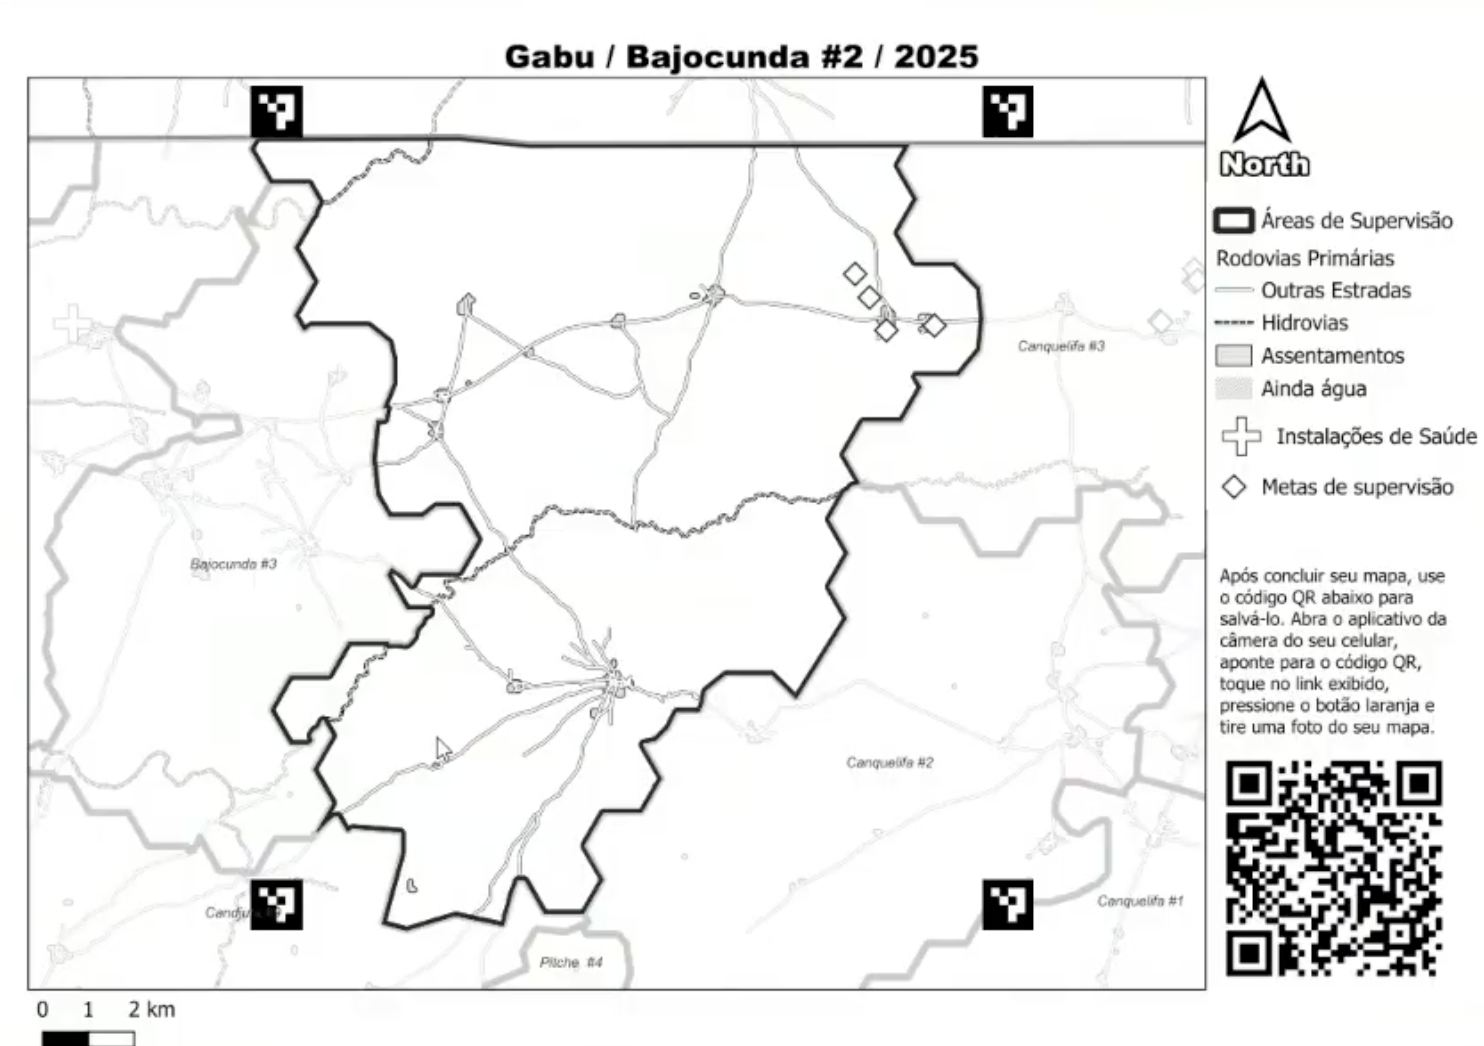
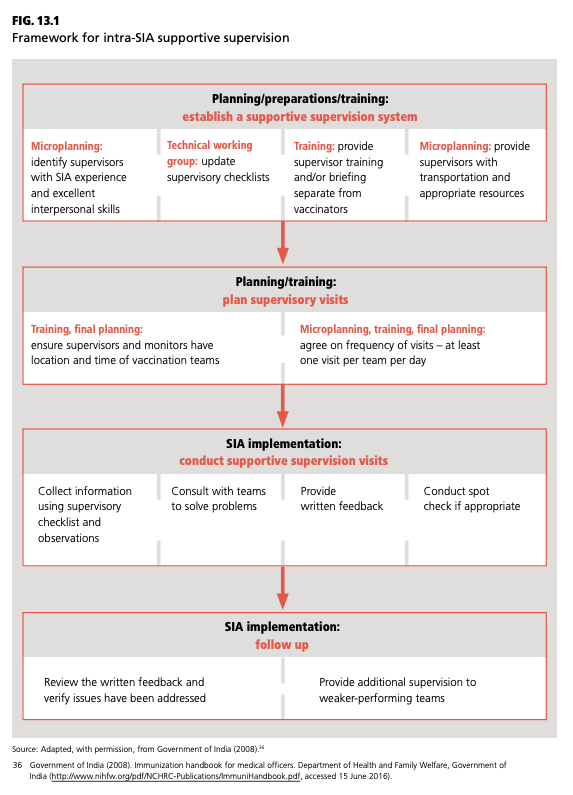
Immunization teams usually stay in their own zone all day to provide immunizations, but supervisors move between four of them to monitor campaign activities.
One supervisor covers generally four teams, and the guide specifies a visit to each team every day. That means four stops in a working day, with enough time left over to help the teams that are behind. Whether a supervisor can manage it depends on how far apart the four zones sit. The guide tells programs to agree on the visit frequency and arrange the supervisor's transport during microplanning, not once the campaign has started.
Fair supervisory areas in the Crosscut App size the territories against that ratio, or custom ratio you choose. You set how many teams one supervisor manages, and the app splits the ground so each supervisor gets a workable round rather than four zones spread across a district.
Table: What WHO wants, and where the Crosscut App helps
Keeping the whole microplan organized in one project
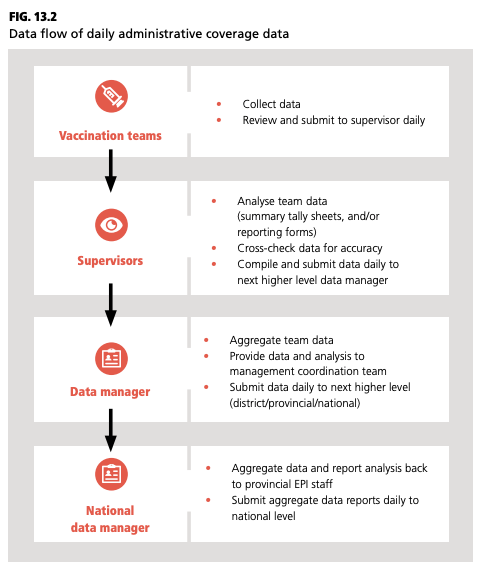
Once the campaign starts, WHO points out that coverage data flows upward daily, from vaccination teams to supervisors to the district data manager and on to national level. Comparing what teams reported against the areas they were assigned is how a district decides where to run mop-up while there is still time to run it.
The Crosscut App keeps the planning and the mapping connected in one place. Catchment boundaries, population estimates, post locations, and team areas all live in the same project, and daily reporting collected in data collection tools such as CommCare, ODK, or KoboCollect comes back into the map it was planned on.
You do not need new data to start. A health facility list, the boundaries you report against, and last campaign's microplan are enough for the Crosscut App to build catchment areas, and it is free to use with no GIS training required. If your older microplans need cleaning up first, our advisory team does that work with programs directly.
Frequently asked questions
What goes into a microplan for an immunization campaign?
The guide asks every district to start from the same planning form: population figures, school locations, hard-to-reach areas, cold-chain inventory, and transit points. Those inputs set the target population, the number of vaccination posts, the team assignments, and the supervision schedule. Collecting them in one format is what lets a district aggregate plans without losing detail on the way up, which is the job the Microplan Collector handles in the Crosscut App.
How many children can one vaccination team cover in a day?
The guide sizes team areas at 100 to 150 children a day in urban areas and 75 to 100 in rural ones. The gap comes from distance rather than effort, since a rural team spends more of the day walking between households. A team assigned more ground than it can cover runs out of days before it runs out of children, which is why post areas get divided into day zones and exported as printable maps.
Why does the target population estimate matter so much?
The target population is the denominator for the coverage figure. A low estimate makes coverage look high while children go unvaccinated, and the shortfall only surfaces in a post-campaign survey. Comparing the submitted figure against WorldPop, GRID3, Meta, and Kontur estimates per catchment area flags the districts where the planning number and the satellite-derived models disagree.
How do you decide where to put vaccination posts?
The guide uses fixed posts at health facilities, temporary posts at schools or other venues, and mobile teams for villages too remote to reach a post. The test is whether a caregiver can walk there and back in a morning, so travel time across the catchment area is a better guide than distance. Two-tier catchments hold each post's area inside its health facility catchment, the way the microplan is structured.
How many teams should one supervisor have?
The guide sets one supervisor per four teams, with a visit to each team every day of the campaign. The ratio only works if the supervisor can physically reach all four, which depends on how the areas are drawn. Fair supervisory areas size each supervisor's ground to the ratio a program actually runs on, rather than splitting a district into equal shapes on a map.
How do you find the communities a campaign is about to miss?
Missed communities are usually the ones absent from the master list rather than the ones teams skipped. They show up when you read the ground as settlements instead of as a list of known sites, which surfaces the hamlets nobody assigned a team to. Our walkthrough on finding the communities a campaign is missing covers the steps, and daily tally reporting through CommCare and ODK or KoboCollect shows where coverage is lagging while there is still time for a mop-up.
Related reading
Related Posts
Madagascar's schisto MDA: Getting 19 district microplans into one place

What WHO's NTD microplanning manual says about operational maps

.png)
What WHO's indoor residual spraying manual says about catchment area maps
